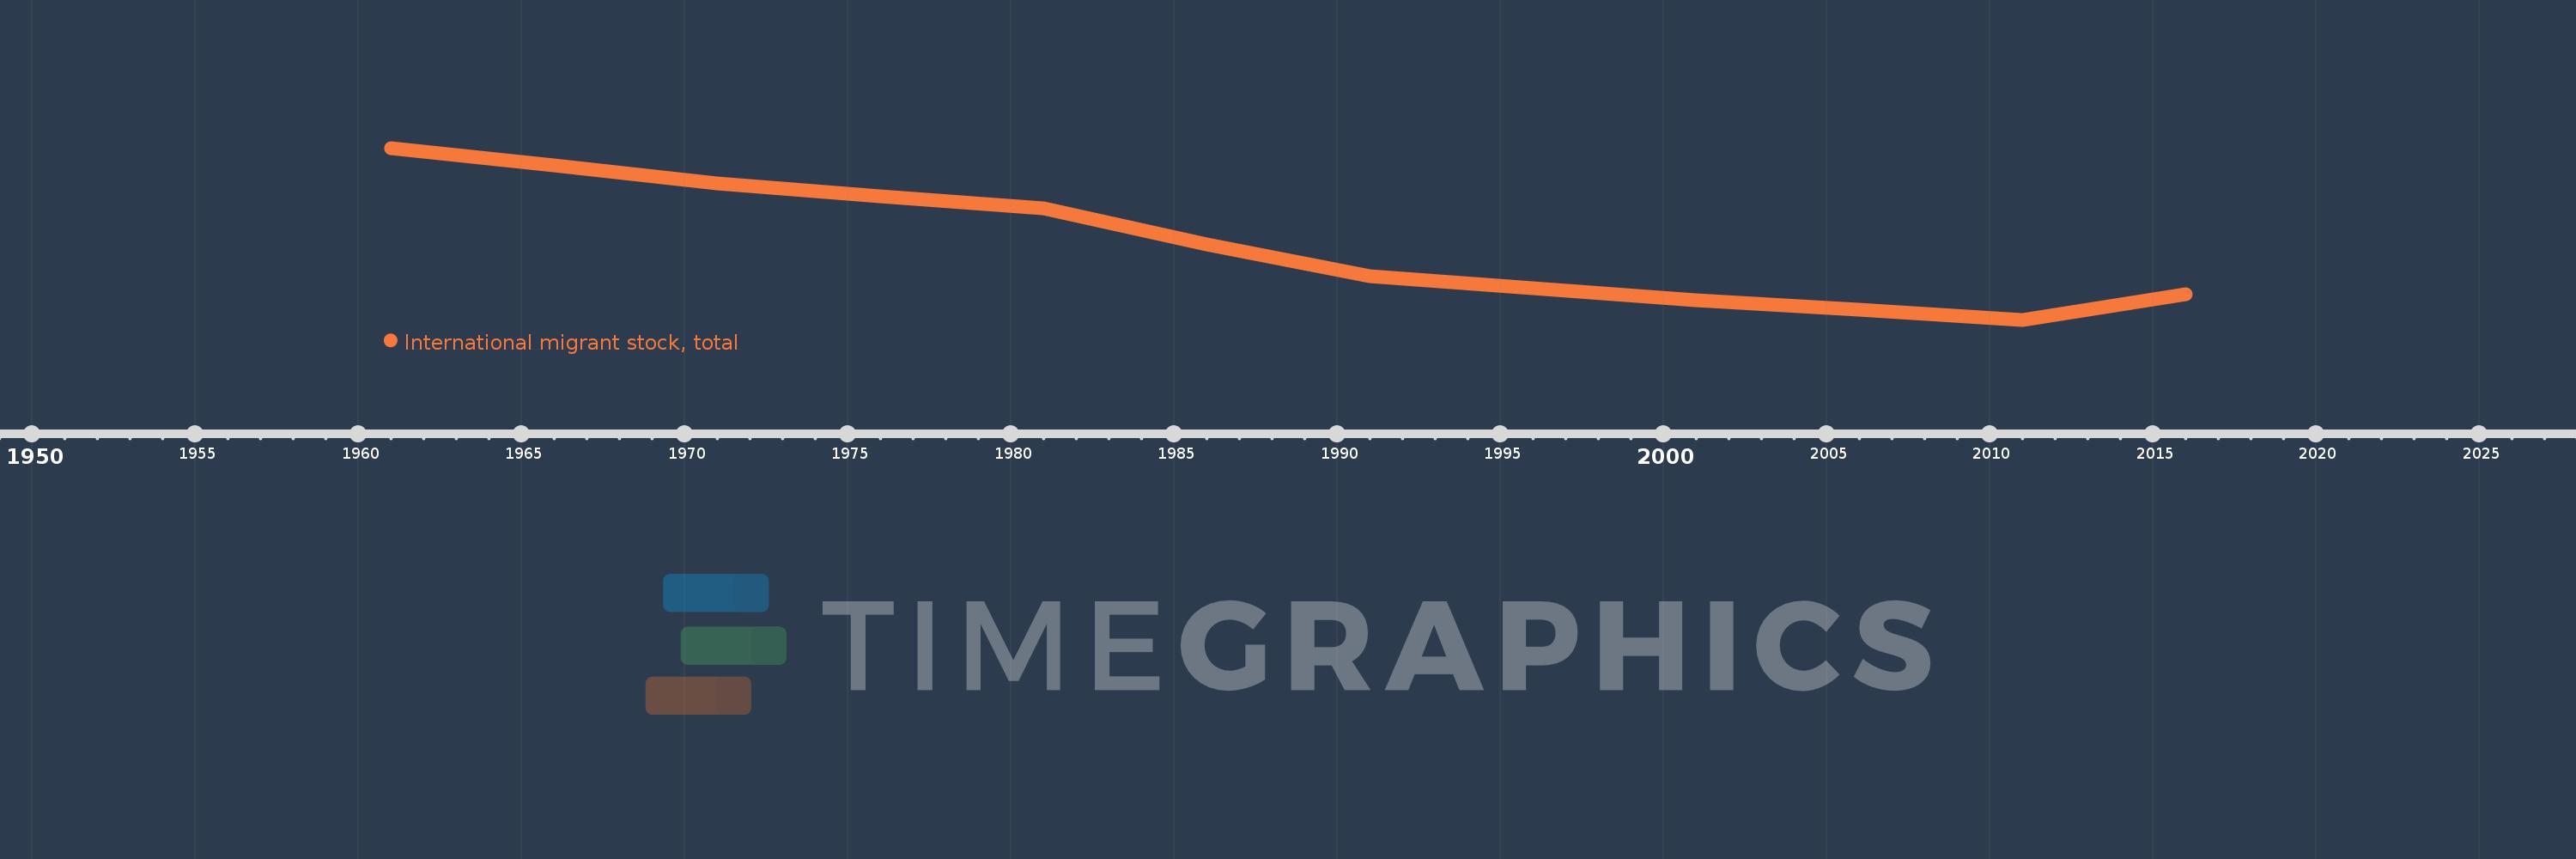
Questa scala temporale mostra un grafico dal 1961 anno al 2016 anno. Brazil. I dati fino ad 1960 anno non disponibili. Il numero di osservazioni attuali secondo i date: 12.
La fonte (nome):
Indicatori dello sviluppo mondiale
La fonte (organizzazione):
United Nations Population Division, Trends in Total Migrant Stock: 2012 Revision.
Categorie:
Financial Sector, Health
sono stati aggiornati
23 apr 2017 anni
Indicatori delle variazioni dei valori per anni
In media:
945.099 Mille.
Minima:
592.568 Mille.
1 gen 2011 anni
Massimo:
1.397 Mln
1 gen 1961 anni
Alla data di osservazione
Valore
Variazione assoluta
La variazione rispetto al valore precedente
1 gen 1961 anni
1.397 Mln
+1.397 Mln
0.0%
1 gen 1966 anni
1.315 Mln
-82.197 Mille.
-5.88%
1 gen 1971 anni
1.232 Mln
-83.088 Mille.
-6.32%
1 gen 1976 anni
1.171 Mln
-61.301 Mille.
-4.98%
1 gen 1981 anni
1.113 Mln
-57.699 Mille.
-4.93%
1 gen 1986 anni
944.562 Mille.
-168.272 Mille.
-15.12%
1 gen 1991 anni
798.517 Mille.
-146.045 Mille.
-15.46%
1 gen 1996 anni
741.557 Mille.
-56.96 Mille.
-7.13%
1 gen 2001 anni
684.596 Mille.
-56.961 Mille.
-7.68%
1 gen 2006 anni
638.582 Mille.
-46.014 Mille.
-6.72%
1 gen 2011 anni
592.568 Mille.
-46.014 Mille.
-7.21%
1 gen 2016 anni
713.568 Mille.
+121.0 Mille.
20.42%
Classificazione dei paesi secondo i statistiche attuali per anni