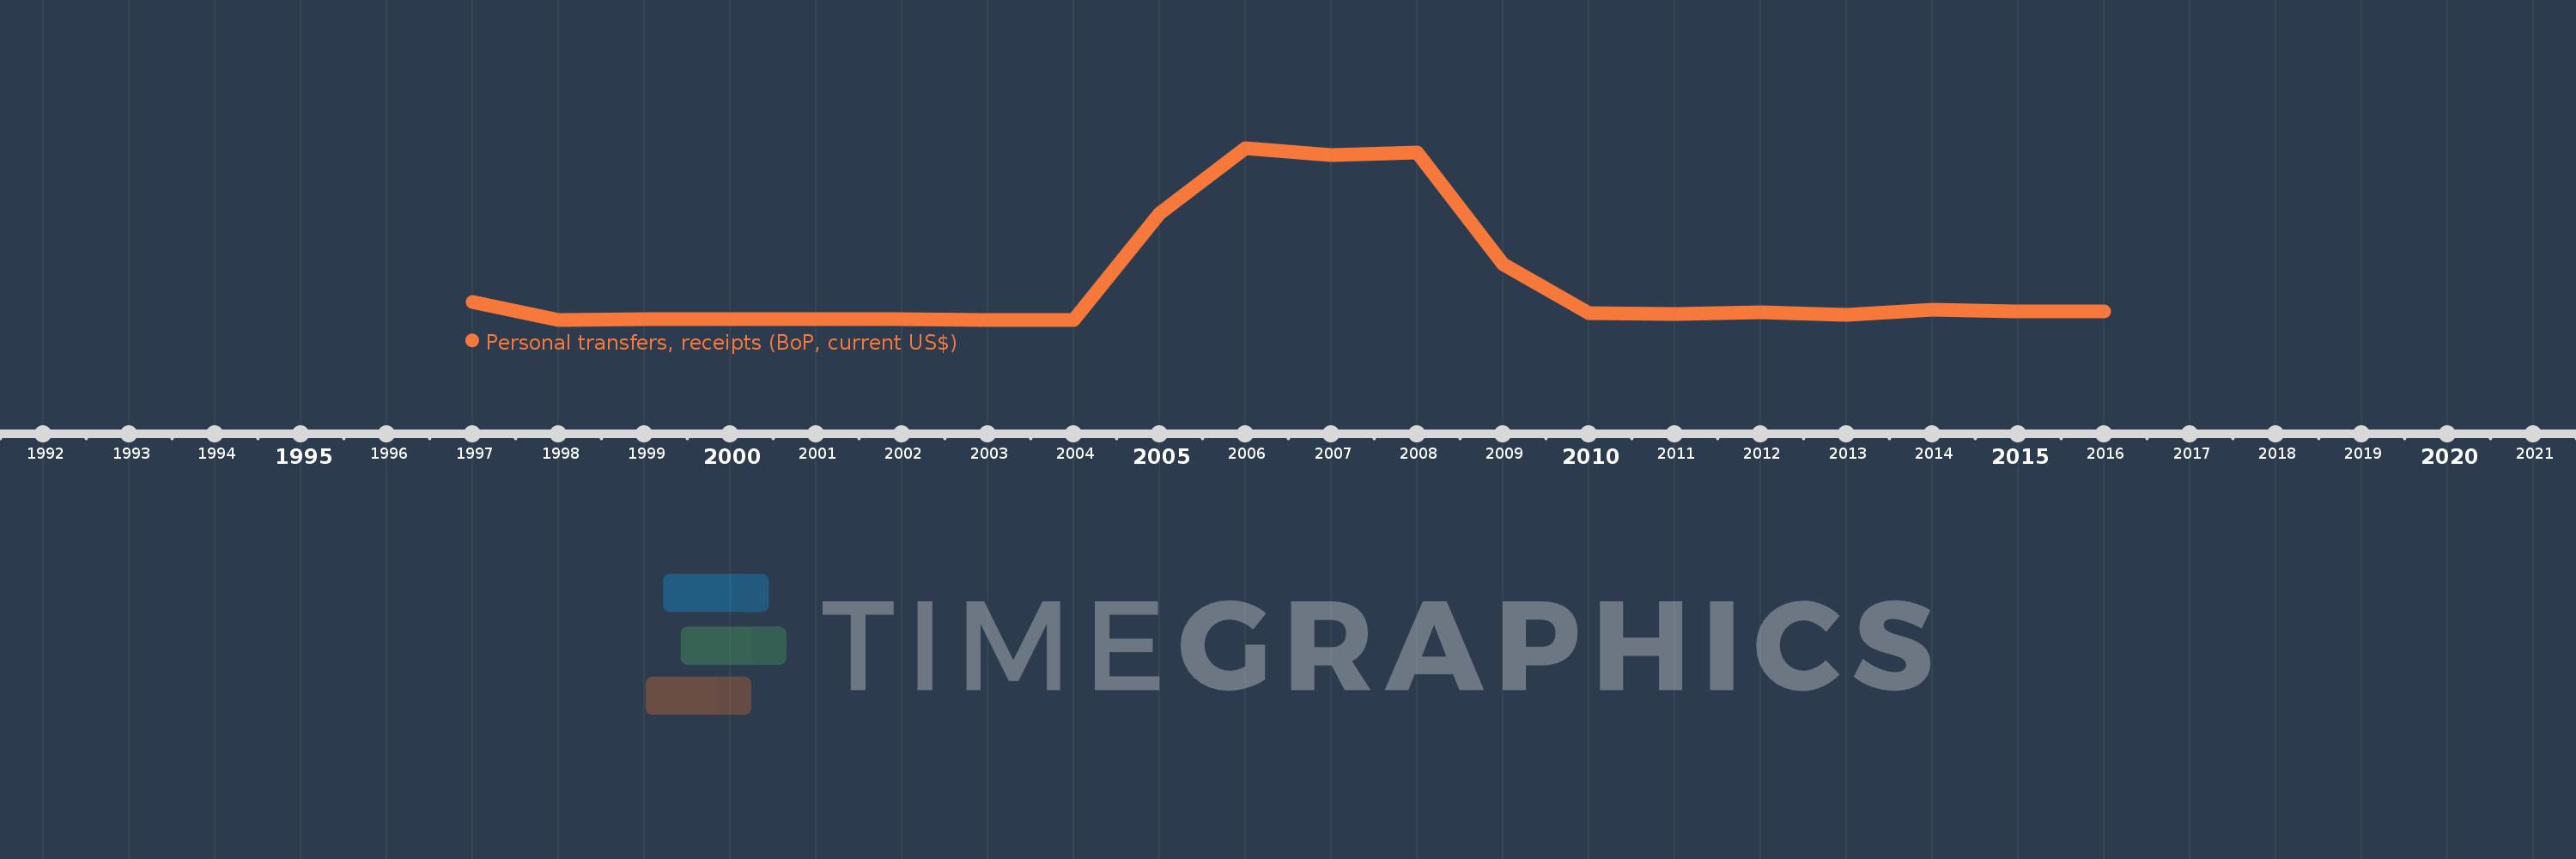
Questa scala temporale mostra un grafico dal 1997 anno al 2016 anno. Botswana. I dati fino ad 1996 anno non disponibili. Il numero di osservazioni attuali secondo i date: 20.
La fonte (nome):
Indicatori dello sviluppo mondiale
La fonte (organizzazione):
International Monetary Fund, Balance of Payments Statistics Yearbook and data files.
Categorie:
Economy & Growth, Financial Sector
sono stati aggiornati
23 apr 2017 anni
Indicatori delle variazioni dei valori per anni
In media:
17.627 Mln
Minima:
15.803 Mille.
1 gen 2003 anni
Massimo:
82.356 Mln
1 gen 2006 anni
Alla data di osservazione
Valore
Variazione assoluta
La variazione rispetto al valore precedente
1 gen 1997 anni
8.333 Mln
+8.333 Mln
0.0%
1 gen 1998 anni
52.318 Mille.
-8.281 Mln
-99.37%
1 gen 1999 anni
390.688 Mille.
+338.37 Mille.
646.76%
1 gen 2000 anni
151.371 Mille.
-239.317 Mille.
-61.26%
1 gen 2001 anni
352.816 Mille.
+201.444 Mille.
133.08%
1 gen 2002 anni
362.314 Mille.
+9.499 Mille.
2.69%
1 gen 2003 anni
15.803 Mille.
-346.511 Mille.
-95.64%
1 gen 2004 anni
22.627 Mille.
+6.823 Mille.
43.18%
1 gen 2005 anni
50.822 Mln
+50.799 Mln
224.51 Mille.%
1 gen 2006 anni
82.356 Mln
+31.535 Mln
62.05%
1 gen 2007 anni
78.743 Mln
-3.613 Mln
-4.39%
1 gen 2008 anni
80.039 Mln
+1.296 Mln
1.65%
1 gen 2009 anni
26.506 Mln
-53.533 Mln
-66.88%
1 gen 2010 anni
3.005 Mln
-23.5 Mln
-88.66%
1 gen 2011 anni
2.902 Mln
-103.145 Mille.
-3.43%
1 gen 2012 anni
3.411 Mln
+508.953 Mille.
17.54%
1 gen 2013 anni
2.266 Mln
-1.145 Mln
-33.56%
1 gen 2014 anni
4.903 Mln
+2.637 Mln
116.35%
1 gen 2015 anni
4.073 Mln
-830.06 Mille.
-16.93%
1 gen 2016 anni
3.839 Mln
-234.509 Mille.
-5.76%
Classificazione dei paesi secondo i statistiche attuali per anni