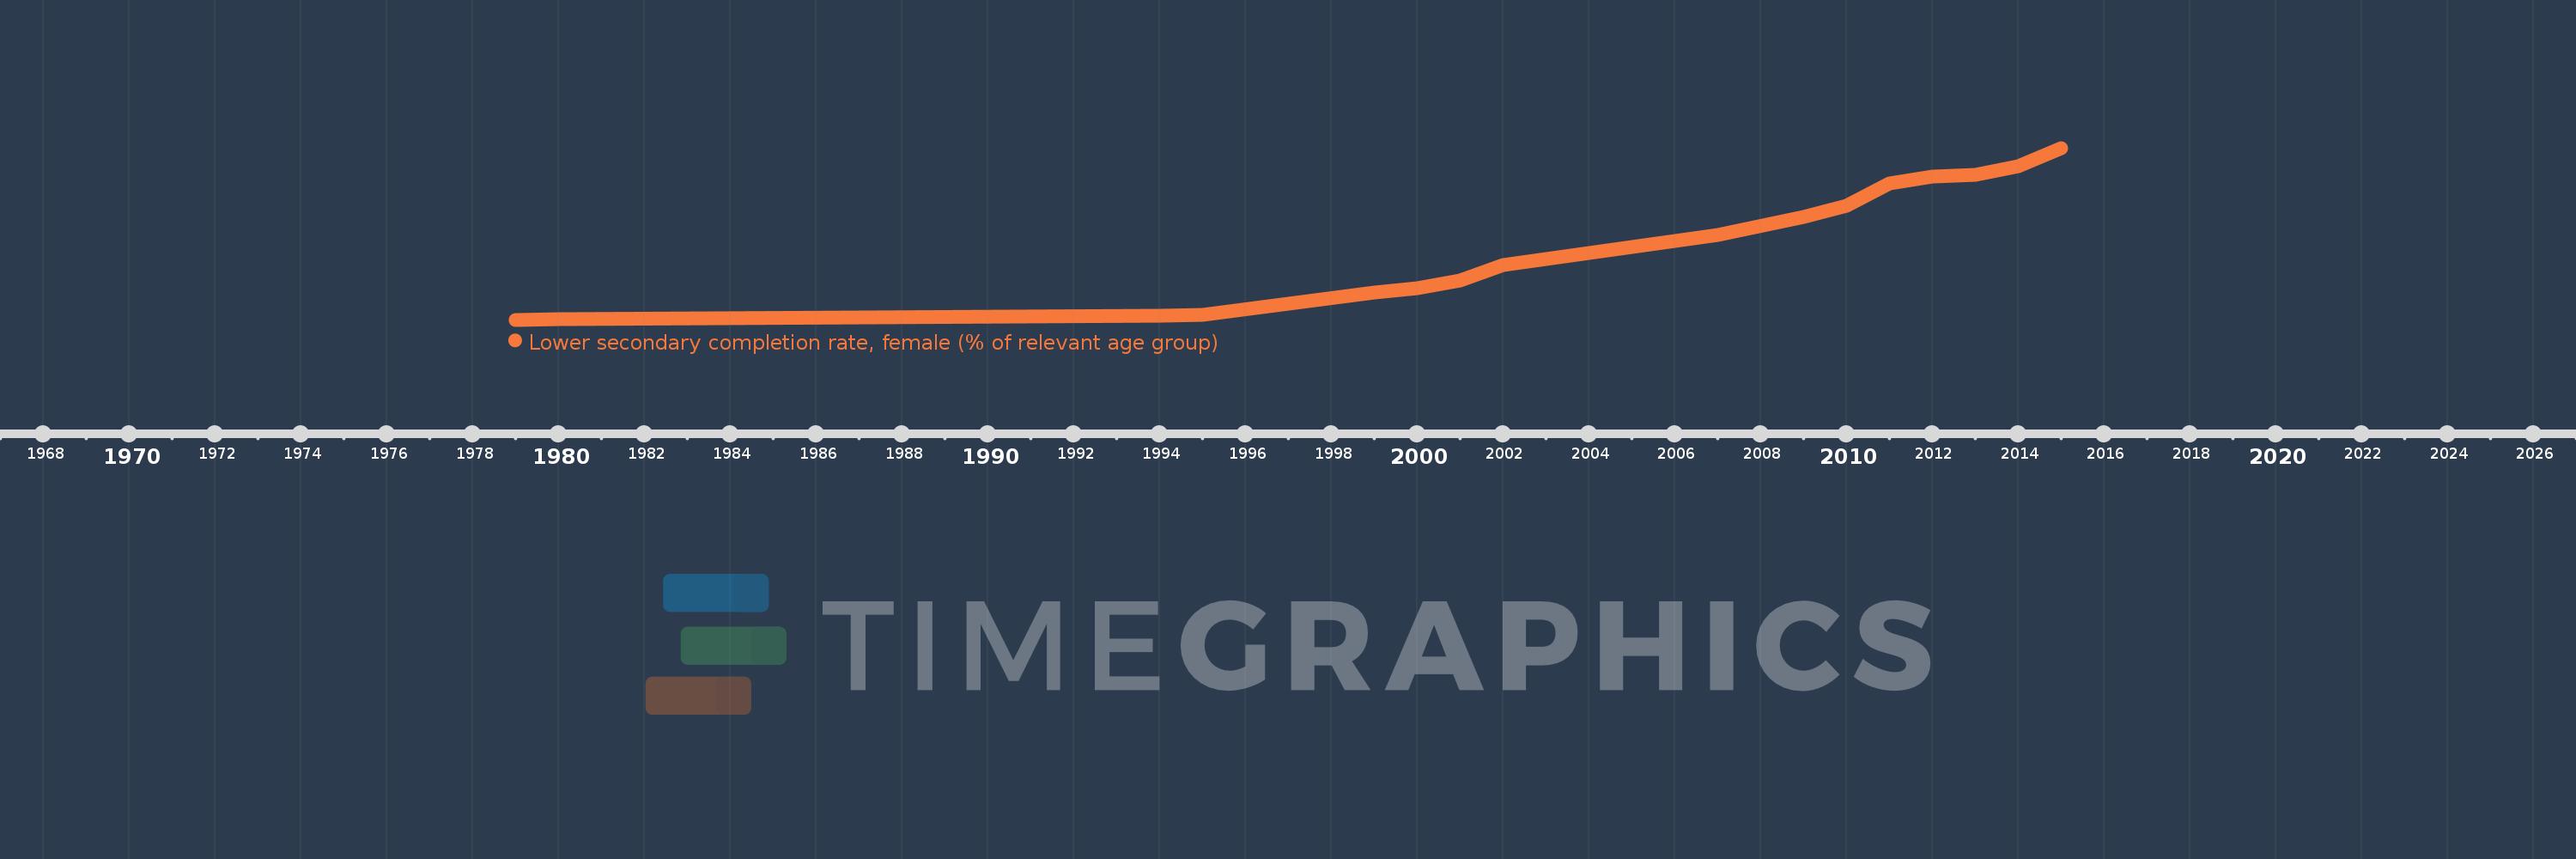
Questa scala temporale mostra un grafico dal 1979 anno al 2015 anno. Bhutan. I dati fino ad 1978 anno non disponibili. Il numero di osservazioni attuali secondo i date: 16.
La fonte (nome):
Indicatori dello sviluppo mondiale
La fonte (organizzazione):
United Nations Educational, Scientific, and Cultural Organization (UNESCO) Institute for Statistics.
Categorie:
Education
sono stati aggiornati
23 apr 2017 anni
Indicatori delle variazioni dei valori per anni
In media:
37.589
Minima:
1.017
1 gen 1979 anni
Massimo:
83.821
1 gen 2015 anni
Alla data di osservazione
Valore
Variazione assoluta
La variazione rispetto al valore precedente
1 gen 1979 anni
1.017
+1.017
0.0%
1 gen 1980 anni
1.132
+0.115
11.27%
1 gen 1994 anni
3.07
+1.939
171.33%
1 gen 1995 anni
3.26
+0.19
6.19%
1 gen 1999 anni
14.246
+10.986
336.94%
1 gen 2000 anni
16.036
+1.79
12.56%
1 gen 2001 anni
19.943
+3.907
24.36%
1 gen 2002 anni
27.531
+7.588
38.05%
1 gen 2007 anni
41.999
+14.469
52.55%
1 gen 2009 anni
50.446
+8.446
20.11%
1 gen 2010 anni
56.163
+5.717
11.33%
1 gen 2011 anni
66.711
+10.548
18.78%
1 gen 2012 anni
70.088
+3.377
5.06%
1 gen 2013 anni
71.057
+0.968
1.38%
1 gen 2014 anni
74.898
+3.841
5.41%
1 gen 2015 anni
83.821
+8.922
11.91%
Classificazione dei paesi secondo i statistiche attuali per anni