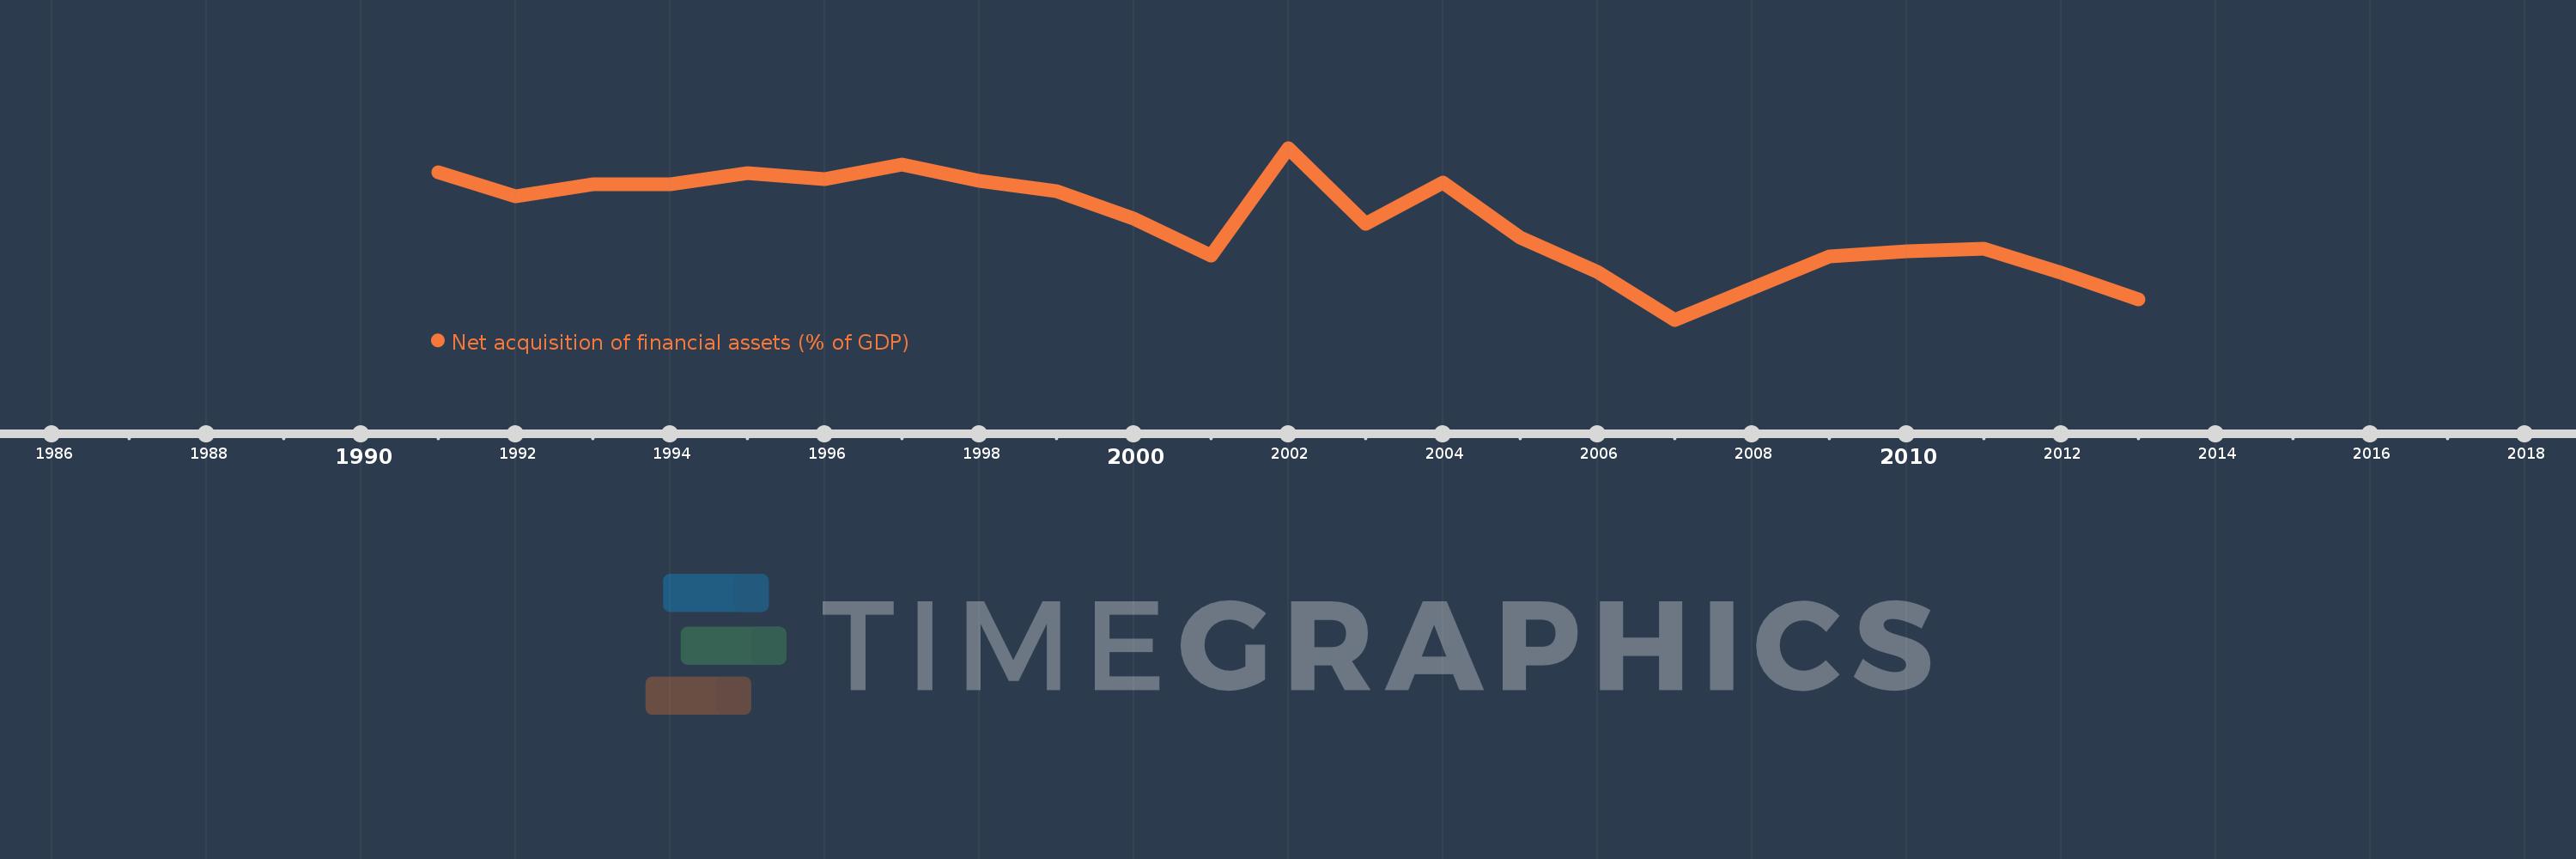
Questa scala temporale mostra un grafico dal 1991 anno al 2013 anno. Belgium. I dati fino ad 1990 anno non disponibili. Il numero di osservazioni attuali secondo i date: 23.
La fonte (nome):
Indicatori dello sviluppo mondiale
La fonte (organizzazione):
International Monetary Fund, Government Finance Statistics Yearbook and data files.
Categorie:
Public Sector
sono stati aggiornati
23 apr 2017 anni
Indicatori delle variazioni dei valori per anni
In media:
-0.08
Minima:
-0.515
1 gen 2007 anni
Massimo:
0.248
1 gen 2002 anni
Alla data di osservazione
Valore
Variazione assoluta
La variazione rispetto al valore precedente
1 gen 1991 anni
0.14
+0.14
0.0%
1 gen 1992 anni
0.033
-0.107
-76.26%
1 gen 1993 anni
0.086
+0.053
160.09%
1 gen 1994 anni
0.087
+0.001
0.62%
1 gen 1995 anni
0.136
+0.049
56.59%
1 gen 1996 anni
0.108
-0.028
-20.28%
1 gen 1997 anni
0.173
+0.064
59.24%
1 gen 1998 anni
0.103
-0.069
-40.19%
1 gen 1999 anni
0.055
-0.048
-46.76%
1 gen 2000 anni
-0.067
-0.122
-221.17%
1 gen 2001 anni
-0.231
-0.165
247.18%
1 gen 2002 anni
0.248
+0.479
-206.99%
1 gen 2003 anni
-0.088
-0.336
-135.66%
1 gen 2004 anni
0.094
+0.182
-206.46%
1 gen 2005 anni
-0.148
-0.242
-257.76%
1 gen 2006 anni
-0.301
-0.153
103.3%
1 gen 2007 anni
-0.515
-0.214
70.96%
1 gen 2008 anni
-0.376
+0.14
-27.13%
1 gen 2009 anni
-0.235
+0.14
-37.38%
1 gen 2010 anni
-0.212
+0.023
-9.88%
1 gen 2011 anni
-0.199
+0.013
-6.33%
1 gen 2012 anni
-0.308
-0.109
55.03%
1 gen 2013 anni
-0.425
-0.117
38.14%
Classificazione dei paesi secondo i statistiche attuali per anni