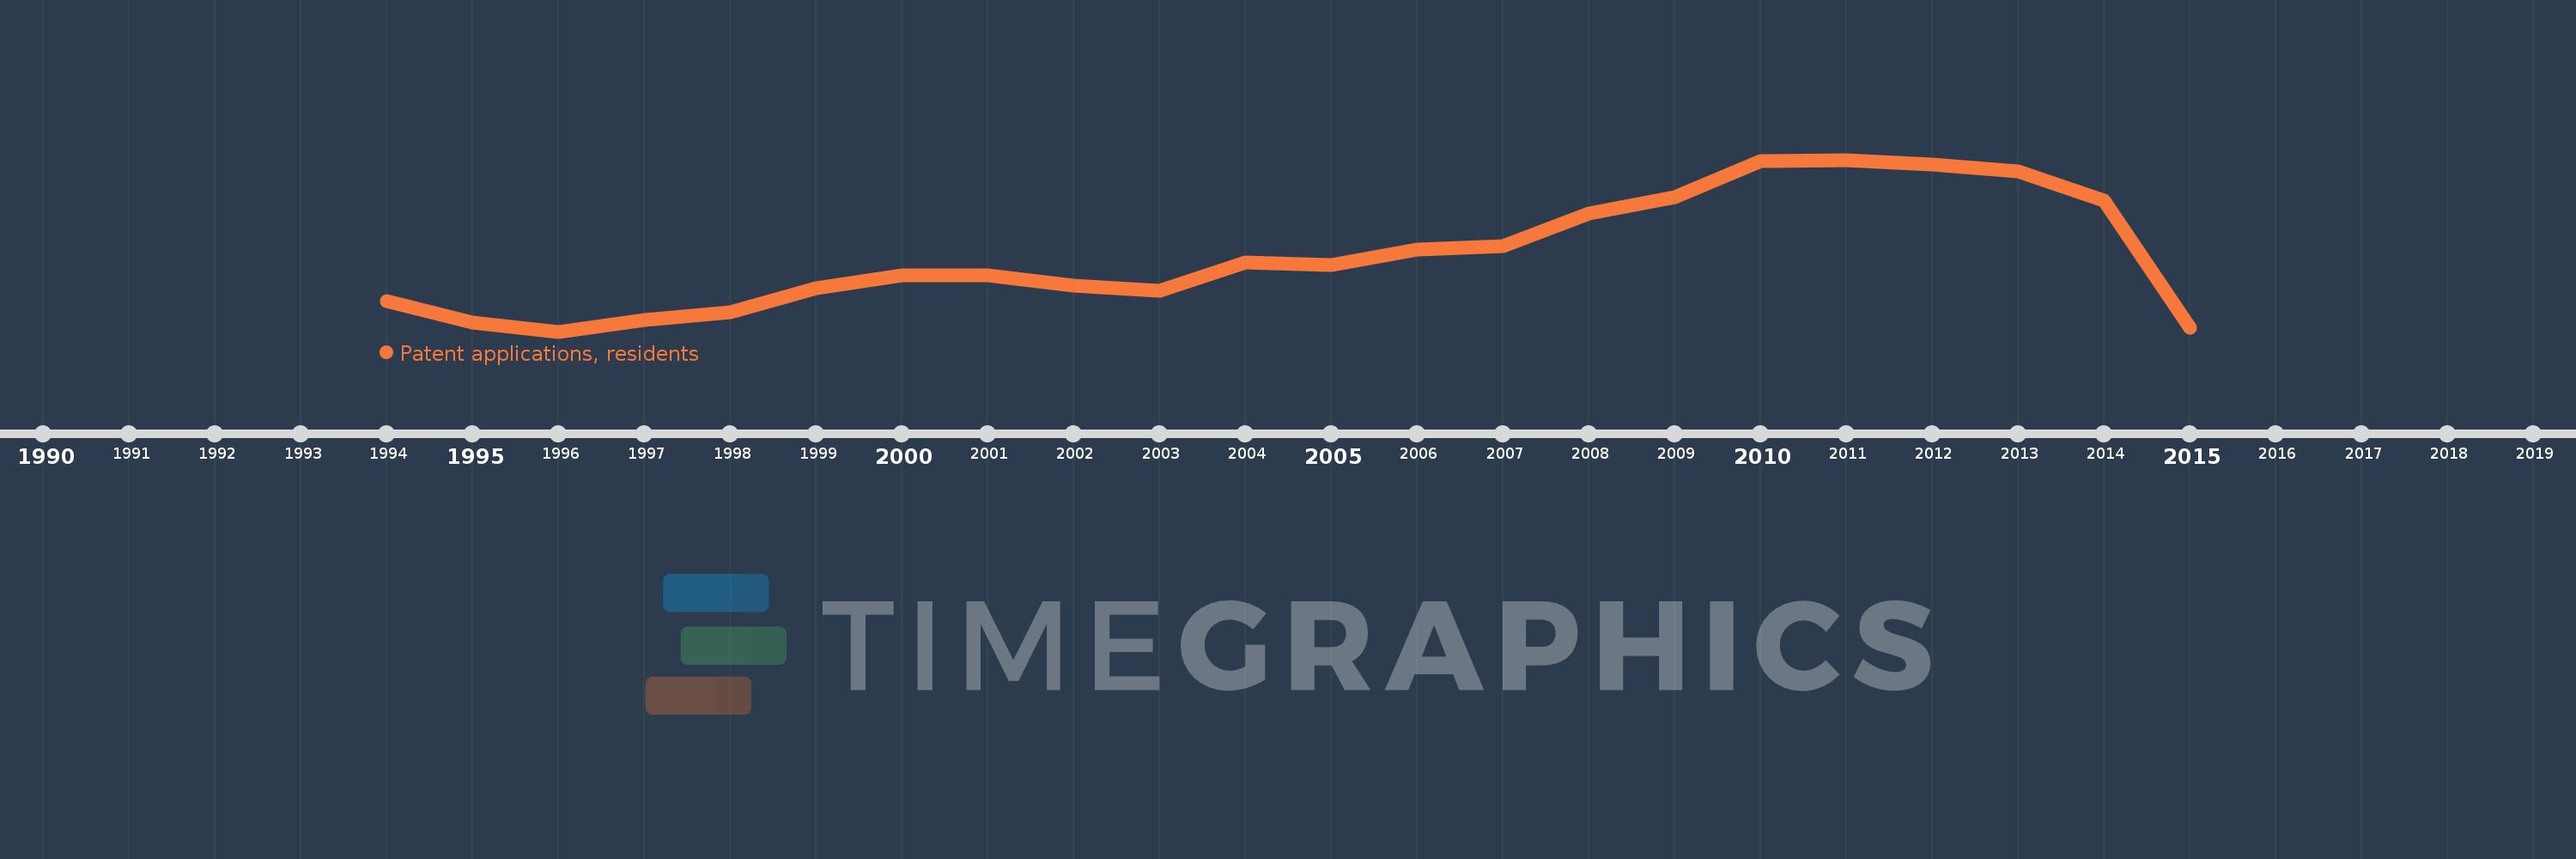
Questa scala temporale mostra un grafico dal 1994 anno al 2015 anno. Belarus. I dati fino ad 1993 anno non disponibili. Il numero di osservazioni attuali secondo i date: 22.
La fonte (nome):
Indicatori dello sviluppo mondiale
La fonte (organizzazione):
World Intellectual Property Organization (WIPO), WIPO Patent Report: Statistics on Worldwide Patent Activity. The International Bureau of WIPO assumes no responsibility with respect to the transformation of these data.
Categorie:
Science & Technology
sono stati aggiornati
23 apr 2017 anni
Indicatori delle variazioni dei valori per anni
In media:
1.126 Mille.
Minima:
624.0
1 gen 1996 anni
Massimo:
1.759 Mille.
1 gen 2011 anni
Alla data di osservazione
Valore
Variazione assoluta
La variazione rispetto al valore precedente
1 gen 1994 anni
828.0
+828.0
0.0%
1 gen 1995 anni
683.0
-145.0
-17.51%
1 gen 1996 anni
624.0
-59.0
-8.64%
1 gen 1997 anni
698.0
+74.0
11.86%
1 gen 1998 anni
752.0
+54.0
7.74%
1 gen 1999 anni
910.0
+158.0
21.01%
1 gen 2000 anni
993.0
+83.0
9.12%
1 gen 2001 anni
994.0
+1.0
0.1%
1 gen 2002 anni
930.0
-64.0
-6.44%
1 gen 2003 anni
895.0
-35.0
-3.76%
1 gen 2004 anni
1.082 Mille.
+187.0
20.89%
1 gen 2005 anni
1.065 Mille.
-17.0
-1.57%
1 gen 2006 anni
1.166 Mille.
+101.0
9.48%
1 gen 2007 anni
1.188 Mille.
+22.0
1.89%
1 gen 2008 anni
1.405 Mille.
+217.0
18.27%
1 gen 2009 anni
1.51 Mille.
+105.0
7.47%
1 gen 2010 anni
1.753 Mille.
+243.0
16.09%
1 gen 2011 anni
1.759 Mille.
+6.0
0.34%
1 gen 2012 anni
1.725 Mille.
-34.0
-1.93%
1 gen 2013 anni
1.681 Mille.
-44.0
-2.55%
1 gen 2014 anni
1.489 Mille.
-192.0
-11.42%
1 gen 2015 anni
652.0
-837.0
-56.21%
Classificazione dei paesi secondo i statistiche attuali per anni