33
/it/
AIzaSyAYiBZKx7MnpbEhh9jyipgxe19OcubqV5w
August 1, 2025
80613
Belarus
BLR
true
2
1
Gross savings (current LCU)
2016,2015,2014,2013,2012,2011,2010,2009,2008,2007,2006,2005,2004,2003,2002,2001,2000,1999,1998,1997,1996,1995,1994
Download
Biblioteca di statistiche globali →Belarus →

Gross savings (current LCU)

Queste statistiche in altri paesi:

AfghanistanAlbaniaAlgeriaAngolaAntigua and BarbudaArgentinaArmeniaAustraliaAustriaAzerbaijanBahamas, TheBahrainBangladeshBarbadosBelarusBelgiumBelizeBeninBermudaBhutanBoliviaBosnia and HerzegovinaBotswanaBrazilBrunei DarussalamBulgariaBurkina FasoBurundiCabo VerdeCambodiaCameroonCanadaCentral African RepublicChadChileChinaColombiaComorosCongo, Dem. Rep.Congo, Rep.Costa RicaCote d'IvoireCroatiaCyprusCzech RepublicDenmarkDjiboutiDominicaDominican RepublicEcuadorEgypt, Arab Rep.El SalvadorEquatorial GuineaEritreaEstoniaEthiopiaFaroe IslandsFijiFinlandFranceGabonGambia, TheGeorgiaGermanyGhanaGreeceGrenadaGuatemalaGuineaGuinea-BissauGuyanaHaitiHondurasHong Kong SAR, ChinaHungaryIcelandIndiaIndonesiaIran, Islamic Rep.IraqIrelandIsraelItalyJamaicaJapanJordanKazakhstanKenyaKiribatiKorea, Rep.KosovoKuwaitKyrgyz RepublicLao PDRLatviaLebanonLesothoLiberiaLibyaLithuaniaLuxembourgMacao SAR, ChinaMacedonia, FYRMadagascarMalawiMalaysiaMaldivesMaliMaltaMauritaniaMauritiusMexicoMoldovaMongoliaMontenegroMoroccoMozambiqueNamibiaNepalNetherlandsNew ZealandNicaraguaNigerNigeriaNorwayOmanPakistanPanamaPapua New GuineaParaguayPeruPhilippinesPolandPortugalQatarRomaniaRussian FederationRwandaSaudi ArabiaSenegalSerbiaSeychellesSierra LeoneSingaporeSlovak RepublicSloveniaSolomon IslandsSouth AfricaSouth SudanSpainSri LankaSt. Kitts and NevisSt. LuciaSt. Vincent and the GrenadinesSudanSurinameSwazilandSwedenSwitzerlandSyrian Arab RepublicTajikistanTanzaniaThailandTimor-LesteTogoTongaTrinidad and TobagoTunisiaTurkeyUgandaUkraineUnited KingdomUnited StatesUruguayVanuatuVenezuela, RBVietnamWest Bank and GazaYemen, Rep.ZambiaZimbabwe

Linea del tempo:

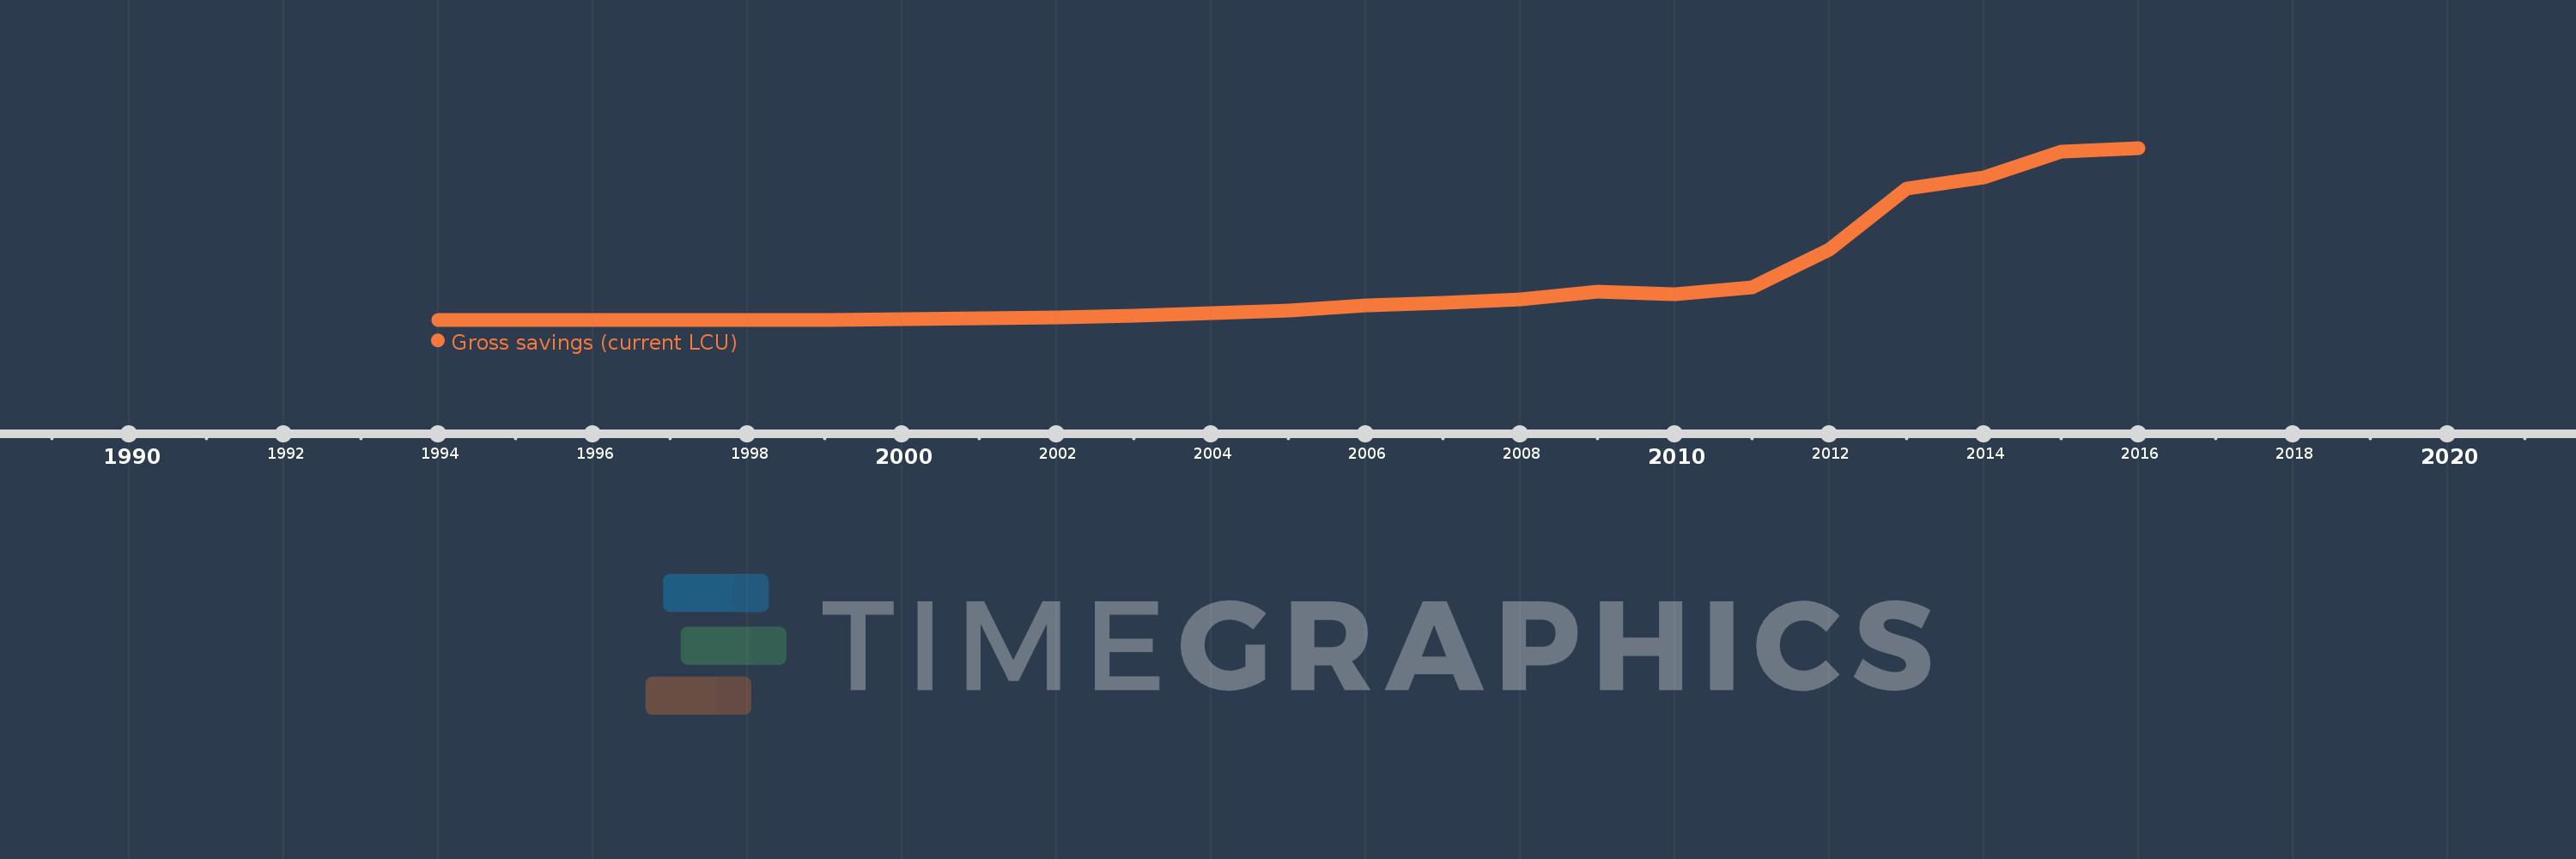
Questa scala temporale mostra un grafico dal 1994 anno al 2016 anno. Belarus. I dati fino ad 1993 anno non disponibili. Il numero di osservazioni attuali secondo i date: 23.

La fonte (nome):

Indicatori dello sviluppo mondiale

La fonte (organizzazione):

World Bank national accounts data, and OECD National Accounts data files.

Categorie:

Economy & Growth

sono stati aggiornati

23 apr 2017 anni

Indicatori delle variazioni dei valori per anni

In media:
48.579 Trln
Minima:
252.909 Mln
1 gen 1994 anni
Massimo:
227.013 Trln
1 gen 2016 anni
Alla data di osservazione
Valore
Variazione assoluta
La variazione rispetto al valore precedente
1 gen 1994 anni
252.909 Mln
+252.909 Mln
0.0%
1 gen 1995 anni
3.569 Mlrd
+3.317 Mlrd
1.31 Mille.%
1 gen 1996 anni
24.937 Mlrd
+21.368 Mlrd
598.63%
1 gen 1997 anni
38.088 Mlrd
+13.151 Mlrd
52.74%
1 gen 1998 anni
77.021 Mlrd
+38.933 Mlrd
102.22%
1 gen 1999 anni
153.593 Mlrd
+76.571 Mlrd
99.42%
1 gen 2000 anni
659.303 Mlrd
+505.71 Mlrd
329.25%
1 gen 2001 anni
2.106 Trln
+1.447 Trln
219.45%
1 gen 2002 anni
3.614 Trln
+1.508 Trln
71.59%
1 gen 2003 anni
5.122 Trln
+1.508 Trln
41.73%
1 gen 2004 anni
8.231 Trln
+3.109 Trln
60.7%
1 gen 2005 anni
11.859 Trln
+3.628 Trln
44.07%
1 gen 2006 anni
19.455 Trln
+7.596 Trln
64.05%
1 gen 2007 anni
22.395 Trln
+2.94 Trln
15.11%
1 gen 2008 anni
26.519 Trln
+4.124 Trln
18.41%
1 gen 2009 anni
37.512 Trln
+10.993 Trln
41.45%
1 gen 2010 anni
33.422 Trln
-4.09 Trln
-10.9%
1 gen 2011 anni
42.843 Trln
+9.421 Trln
28.19%
1 gen 2012 anni
92.842 Trln
+49.999 Trln
116.7%
1 gen 2013 anni
172.987 Trln
+80.145 Trln
86.32%
1 gen 2014 anni
187.862 Trln
+14.875 Trln
8.6%
1 gen 2015 anni
222.581 Trln
+34.719 Trln
18.48%
1 gen 2016 anni
227.013 Trln
+4.432 Trln
1.99%

Classificazione dei paesi secondo i statistiche attuali per anni