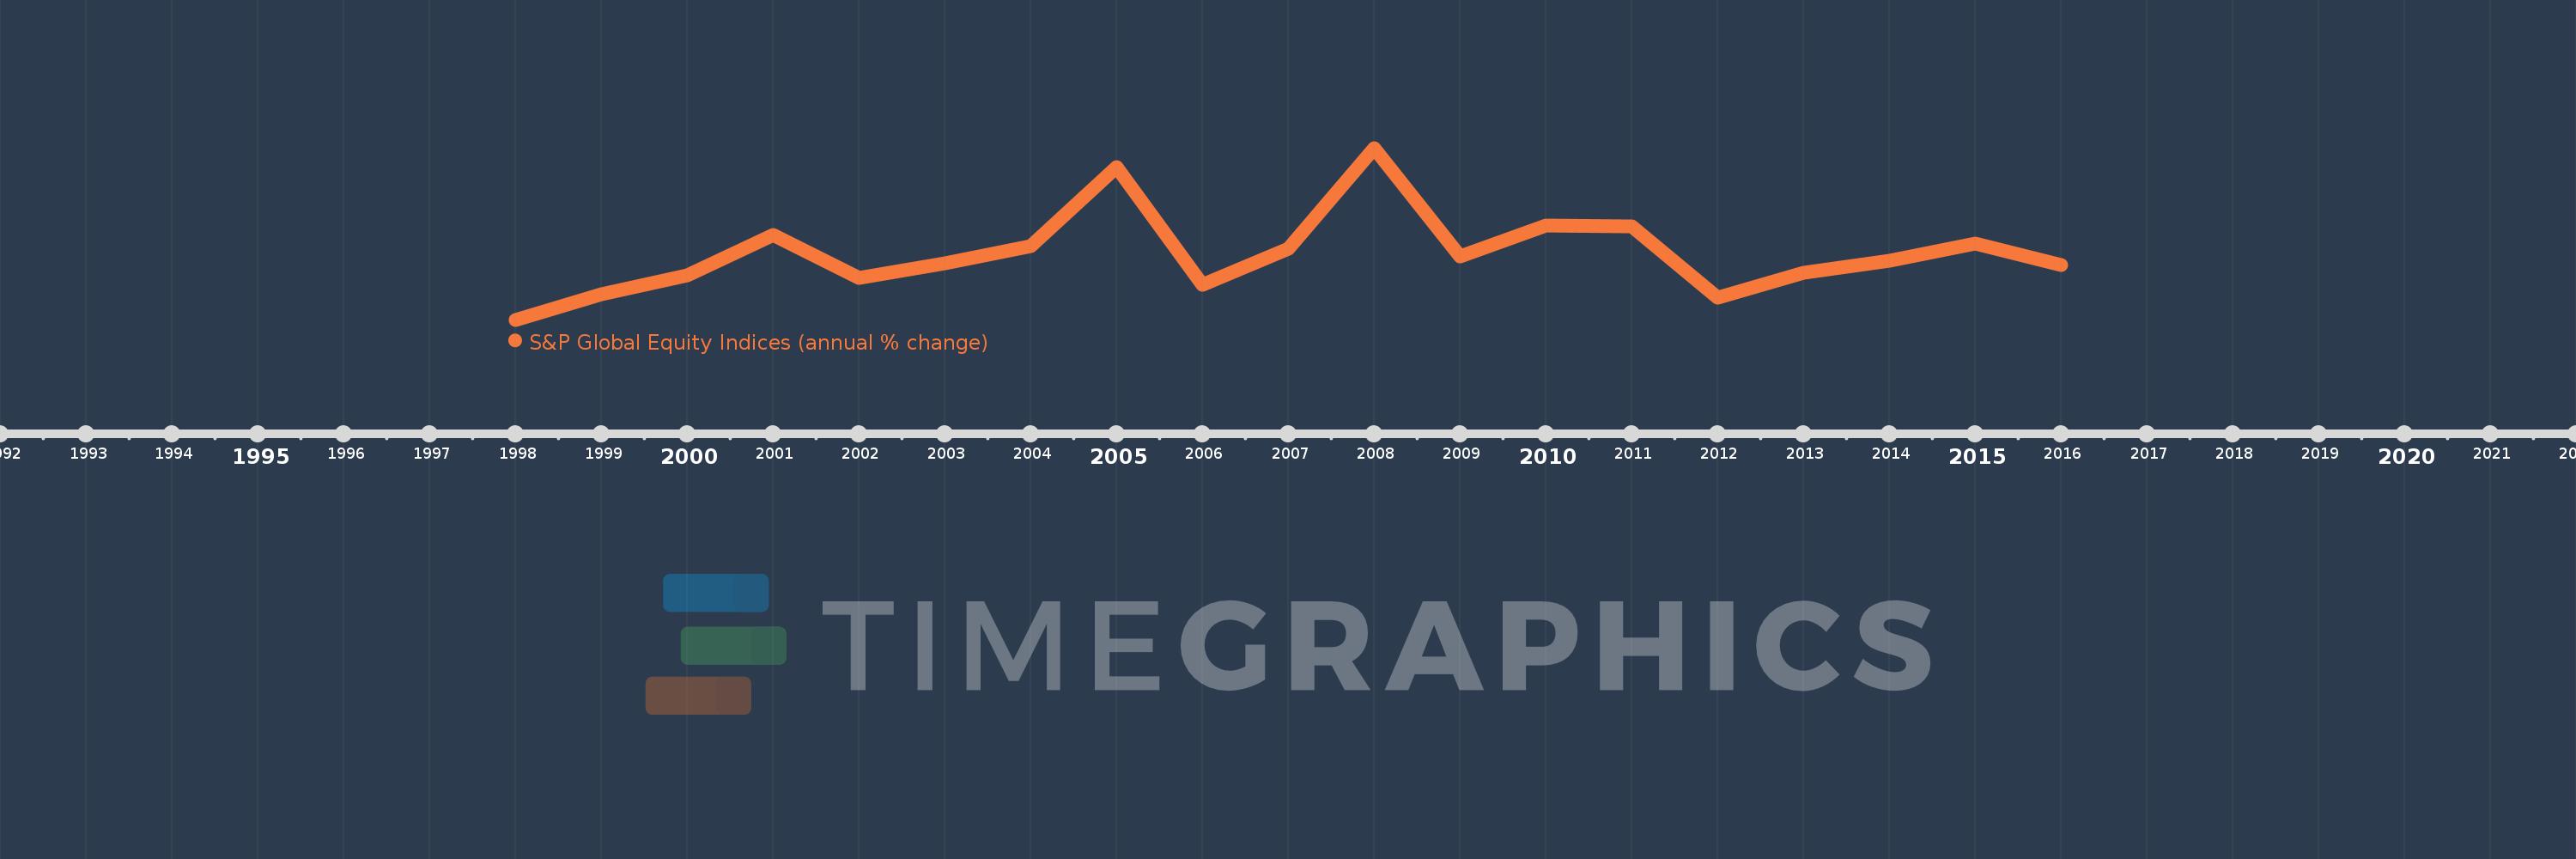
Questa scala temporale mostra un grafico dal 1998 anno al 2016 anno. Bangladesh. I dati fino ad 1997 anno non disponibili. Il numero di osservazioni attuali secondo i date: 19.
La fonte (nome):
Indicatori dello sviluppo mondiale
La fonte (organizzazione):
Standard & Poor's, Global Stock Markets Factbook and supplemental S&P data.
Categorie:
Financial Sector
sono stati aggiornati
23 apr 2017 anni
Indicatori delle variazioni dei valori per anni
In media:
7.726
Minima:
-67.66
1 gen 1998 anni
Massimo:
126.391
1 gen 2008 anni
Alla data di osservazione
Valore
Variazione assoluta
La variazione rispetto al valore precedente
1 gen 1998 anni
-67.66
-67.66
0.0%
1 gen 1999 anni
-38.479
+29.181
-43.13%
1 gen 2000 anni
-17.5
+20.979
-54.52%
1 gen 2001 anni
28.487
+45.987
-262.79%
1 gen 2002 anni
-20.672
-49.16
-172.57%
1 gen 2003 anni
-4.24
+16.432
-79.49%
1 gen 2004 anni
15.37
+19.61
-462.5%
1 gen 2005 anni
104.3
+88.93
578.59%
1 gen 2006 anni
-27.749
-132.049
-126.61%
1 gen 2007 anni
12.855
+40.605
-146.33%
1 gen 2008 anni
126.391
+113.536
883.19%
1 gen 2009 anni
4.253
-122.138
-96.63%
1 gen 2010 anni
38.637
+34.384
808.38%
1 gen 2011 anni
37.642
-0.995
-2.58%
1 gen 2012 anni
-42.308
-79.95
-212.4%
1 gen 2013 anni
-14.32
+27.988
-66.15%
1 gen 2014 anni
-1.377
+12.944
-90.39%
1 gen 2015 anni
18.541
+19.918
-1.45 Mille.%
1 gen 2016 anni
-5.376
-23.918
-129.0%
Classificazione dei paesi secondo i statistiche attuali per anni