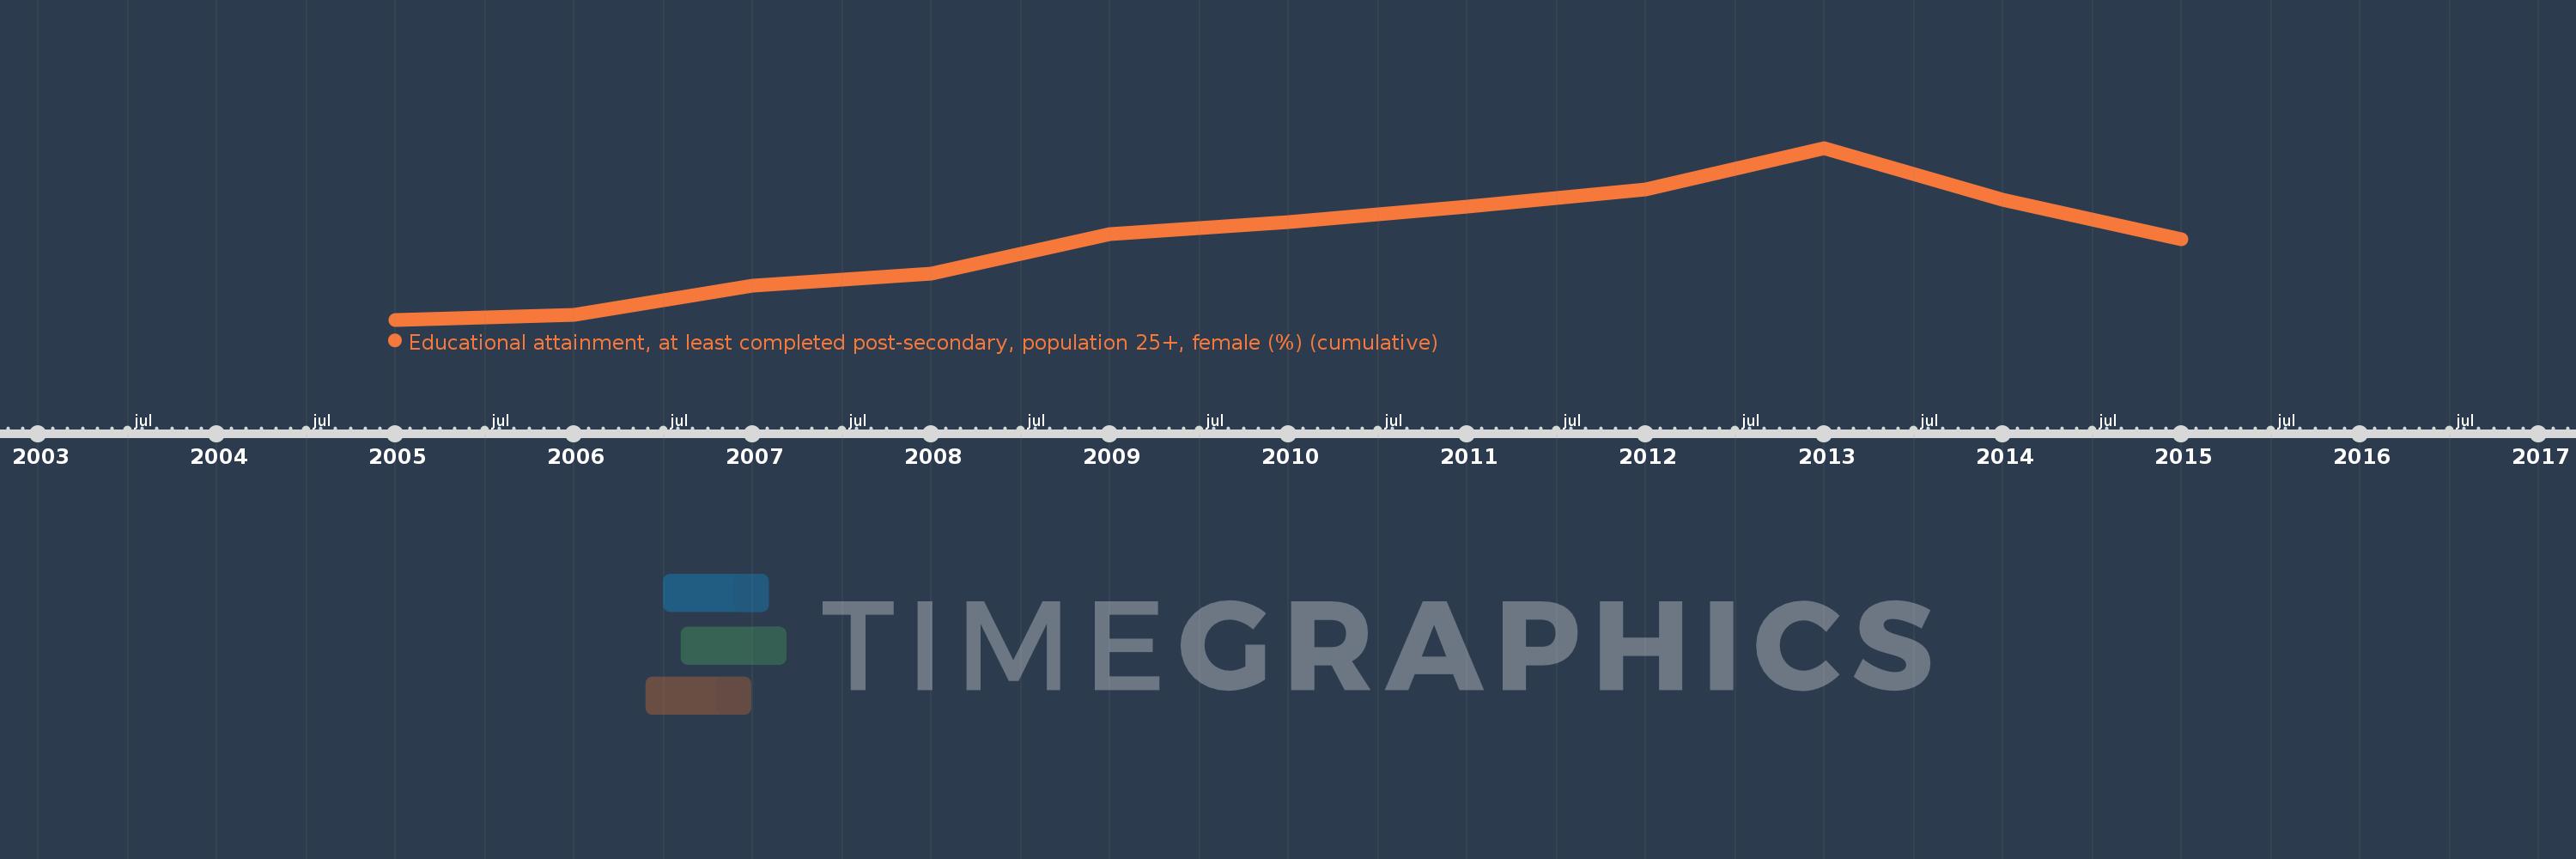
Questa scala temporale mostra un grafico dal 2005 anno al 2015 anno. Australia. I dati fino ad 2004 anno non disponibili. Il numero di osservazioni attuali secondo i date: 11.
La fonte (nome):
Indicatori dello sviluppo mondiale
La fonte (organizzazione):
United Nations Educational, Scientific, and Cultural Organization (UNESCO) Institute for Statistics.
Categorie:
Education, Gender
sono stati aggiornati
23 apr 2017 anni
Indicatori delle variazioni dei valori per anni
In media:
42.405
Minima:
35.691
1 gen 2005 anni
Massimo:
50.07
1 gen 2013 anni
Alla data di osservazione
Valore
Variazione assoluta
La variazione rispetto al valore precedente
1 gen 2005 anni
35.691
+35.691
0.0%
1 gen 2006 anni
36.076
+0.385
1.08%
1 gen 2007 anni
38.536
+2.46
6.82%
1 gen 2008 anni
39.527
+0.991
2.57%
1 gen 2009 anni
42.823
+3.296
8.34%
1 gen 2010 anni
43.833
+1.01
2.36%
1 gen 2011 anni
45.139
+1.306
2.98%
1 gen 2012 anni
46.57
+1.431
3.17%
1 gen 2013 anni
50.07
+3.5
7.52%
1 gen 2014 anni
45.757
-4.313
-8.61%
1 gen 2015 anni
42.429
-3.328
-7.27%
Classificazione dei paesi secondo i statistiche attuali per anni