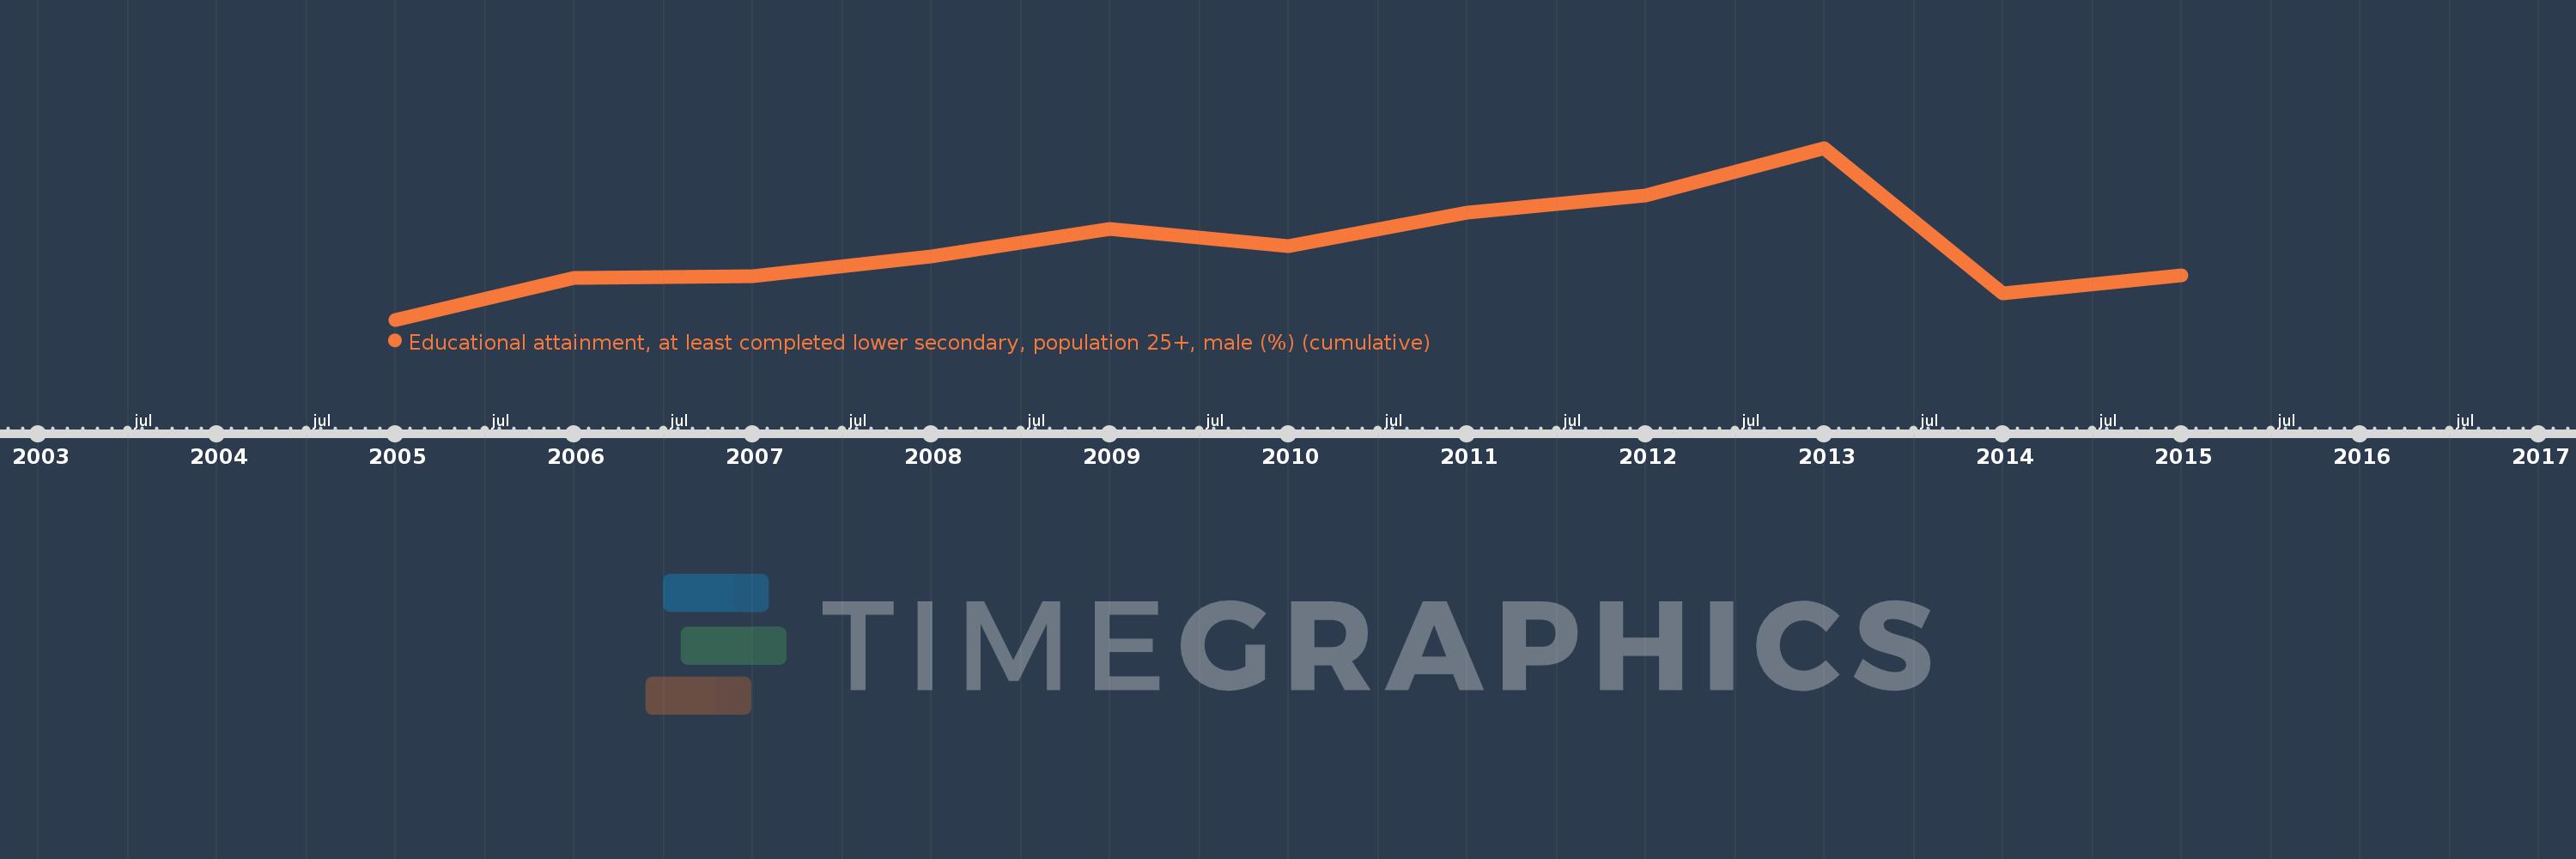
Questa scala temporale mostra un grafico dal 2005 anno al 2015 anno. Australia. I dati fino ad 2004 anno non disponibili. Il numero di osservazioni attuali secondo i date: 11.
La fonte (nome):
Indicatori dello sviluppo mondiale
La fonte (organizzazione):
United Nations Educational, Scientific, and Cultural Organization (UNESCO) Institute for Statistics.
Categorie:
Education, Gender
sono stati aggiornati
23 apr 2017 anni
Indicatori delle variazioni dei valori per anni
In media:
92.186
Minima:
90.447
1 gen 2005 anni
Massimo:
94.622
1 gen 2013 anni
Alla data di osservazione
Valore
Variazione assoluta
La variazione rispetto al valore precedente
1 gen 2005 anni
90.447
+90.447
0.0%
1 gen 2006 anni
91.458
+1.011
1.12%
1 gen 2007 anni
91.512
+0.054
0.06%
1 gen 2008 anni
91.982
+0.469
0.51%
1 gen 2009 anni
92.653
+0.671
0.73%
1 gen 2010 anni
92.236
-0.417
-0.45%
1 gen 2011 anni
93.048
+0.812
0.88%
1 gen 2012 anni
93.472
+0.424
0.46%
1 gen 2013 anni
94.622
+1.15
1.23%
1 gen 2014 anni
91.085
-3.537
-3.74%
1 gen 2015 anni
91.532
+0.447
0.49%
Classificazione dei paesi secondo i statistiche attuali per anni