29
/it/
it
AIzaSyAYiBZKx7MnpbEhh9jyipgxe19OcubqV5w
April 1, 2024
71485
Armenia
ARM
true
2
1
Net bilateral aid flows from DAC donors, Denmark (current US$)
2015,2014,2013,2012,2011,2010,2009,2008,2007,2006,2005,2004,2003,2002,2001,2000,1999,1998,1993
Download
Biblioteca di statistiche globali →Armenia →

Net bilateral aid flows from DAC donors, Denmark (current US$)

Queste statistiche in altri paesi:
AfghanistanAlbaniaAlgeriaAngolaArab WorldArgentinaArmeniaAzerbaijanBahrainBangladeshBelarusBelizeBeninBhutanBoliviaBosnia and HerzegovinaBotswanaBrazilBulgariaBurkina FasoBurundiCabo VerdeCambodiaCameroonCaribbean small statesCentral African RepublicCentral Europe and the BalticsChadChileChinaColombiaComorosCongo, Dem. Rep.Congo, Rep.Costa RicaCote d'IvoireCroatiaCubaCyprusCzech RepublicDjiboutiDominicaDominican RepublicEast Asia & PacificEast Asia & Pacific (excluding high income)East Asia & Pacific (IDA & IBRD countries)EcuadorEgypt, Arab Rep.El SalvadorEritreaEstoniaEthiopiaEuro areaEurope & Central AsiaEurope & Central Asia (excluding high income)Europe & Central Asia (IDA & IBRD countries)European UnionFijiFragile and conflict affected situationsGambia, TheGeorgiaGhanaGrenadaGuatemalaGuineaGuinea-BissauGuyanaHaitiHeavily indebted poor countries (HIPC)High incomeHondurasHungaryIBRD onlyIDA & IBRD totalIDA blendIDA onlyIDA totalIndiaIndonesiaIran, Islamic Rep.IraqIsraelJamaicaJordanKazakhstanKenyaKorea, Dem. People’s Rep.Korea, Rep.KosovoKuwaitKyrgyz RepublicLao PDRLatin America & Caribbean Latin America & Caribbean (excluding high income)Latin America & the Caribbean (IDA & IBRD countries)LatviaLeast developed countries: UN classificationLebanonLesothoLiberiaLibyaLithuaniaLow & middle incomeLow incomeLower middle incomeMacedonia, FYRMadagascarMalawiMalaysiaMaldivesMaliMaltaMauritaniaMauritiusMexicoMiddle East & North AfricaMiddle East & North Africa (excluding high income)Middle East & North Africa (IDA & IBRD countries)Middle incomeMoldovaMongoliaMontenegroMoroccoMozambiqueMyanmarNamibiaNepalNicaraguaNigerNigeriaOECD membersOmanOther small statesPacific island small statesPakistanPanamaPapua New GuineaParaguayPeruPhilippinesPolandRomaniaRussian FederationRwandaSamoaSenegalSerbiaSeychellesSierra LeoneSingaporeSlovak RepublicSloveniaSmall statesSolomon IslandsSomaliaSouth AfricaSouth AsiaSouth Asia (IDA & IBRD)South SudanSri LankaSub-Saharan Africa Sub-Saharan Africa (excluding high income)Sub-Saharan Africa (IDA & IBRD countries)SudanSwazilandSyrian Arab RepublicTajikistanTanzaniaThailandTimor-LesteTogoTongaTrinidad and TobagoTunisiaTurkeyTurkmenistanUgandaUkraineUpper middle incomeUruguayUzbekistanVanuatuVenezuela, RBVietnamWest Bank and GazaWorldYemen, Rep.ZambiaZimbabwe
Linea del tempo:
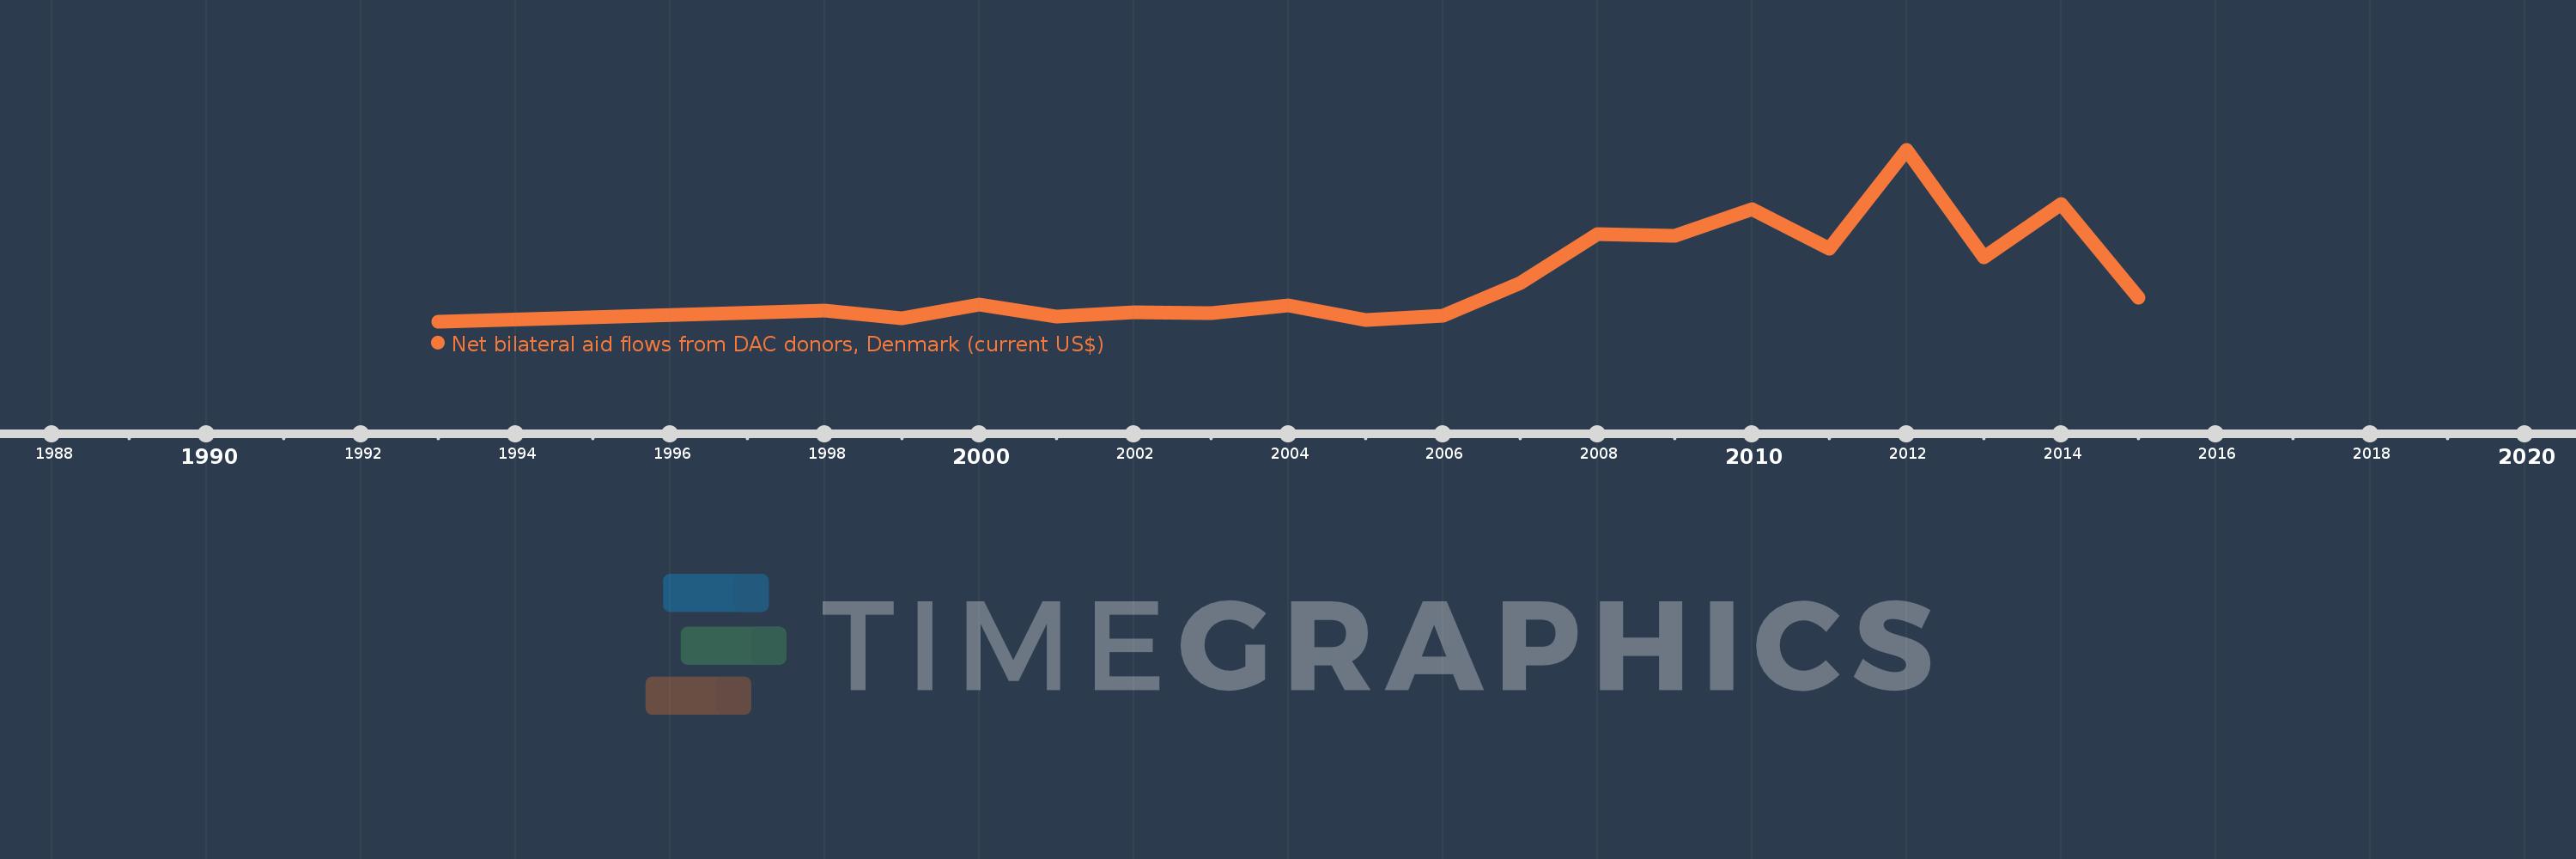
Questa scala temporale mostra un grafico dal 1993 anno al 2015 anno. Armenia. I dati fino ad 1992 anno non disponibili. Il numero di osservazioni attuali secondo i date: 19.
La fonte (nome):
Indicatori dello sviluppo mondiale
La fonte (organizzazione):
Development Assistance Committee of the Organisation for Economic Co-operation and Development, Geographical Distribution of Financial Flows to Developing Countries, Development Co-operation Report, and International Development Statistics database. Data are available online at: www.oecd.org/dac/stats/idsonline.
Categorie:
Aid Effectiveness
sono stati aggiornati
23 apr 2017 anni
Indicatori delle variazioni dei valori per anni
In media:
1.102 Mln
Minima:
10.0 Mille.
1 gen 1993 anni
Massimo:
4.16 Mln
1 gen 2012 anni
Alla data di osservazione
Valore
Variazione assoluta
La variazione rispetto al valore precedente
1 gen 1993 anni
10.0 Mille.
+10.0 Mille.
0.0%
1 gen 1998 anni
290.0 Mille.
+280.0 Mille.
2.8 Mille.%
1 gen 1999 anni
90.0 Mille.
-200.0 Mille.
-68.97%
1 gen 2000 anni
430.0 Mille.
+340.0 Mille.
377.78%
1 gen 2001 anni
140.0 Mille.
-290.0 Mille.
-67.44%
1 gen 2002 anni
250.0 Mille.
+110.0 Mille.
78.57%
1 gen 2003 anni
220.0 Mille.
-30.0 Mille.
-12.0%
1 gen 2004 anni
410.0 Mille.
+190.0 Mille.
86.36%
1 gen 2005 anni
60.0 Mille.
-350.0 Mille.
-85.37%
1 gen 2006 anni
160.0 Mille.
+100.0 Mille.
166.67%
1 gen 2007 anni
940.0 Mille.
+780.0 Mille.
487.5%
1 gen 2008 anni
2.14 Mln
+1.2 Mln
127.66%
1 gen 2009 anni
2.09 Mln
-50.0 Mille.
-2.34%
1 gen 2010 anni
2.74 Mln
+650.0 Mille.
31.1%
1 gen 2011 anni
1.78 Mln
-960.0 Mille.
-35.04%
1 gen 2012 anni
4.16 Mln
+2.38 Mln
133.71%
1 gen 2013 anni
1.57 Mln
-2.59 Mln
-62.26%
1 gen 2014 anni
2.86 Mln
+1.29 Mln
82.17%
1 gen 2015 anni
590.0 Mille.
-2.27 Mln
-79.37%
Classificazione dei paesi secondo i statistiche attuali per anni

Commenti:

Inviare
PremiumAbout & FeedbackAccordoPrivatezza
logo
© 2022 Selected Technologies LLC – Morgan Hill, California