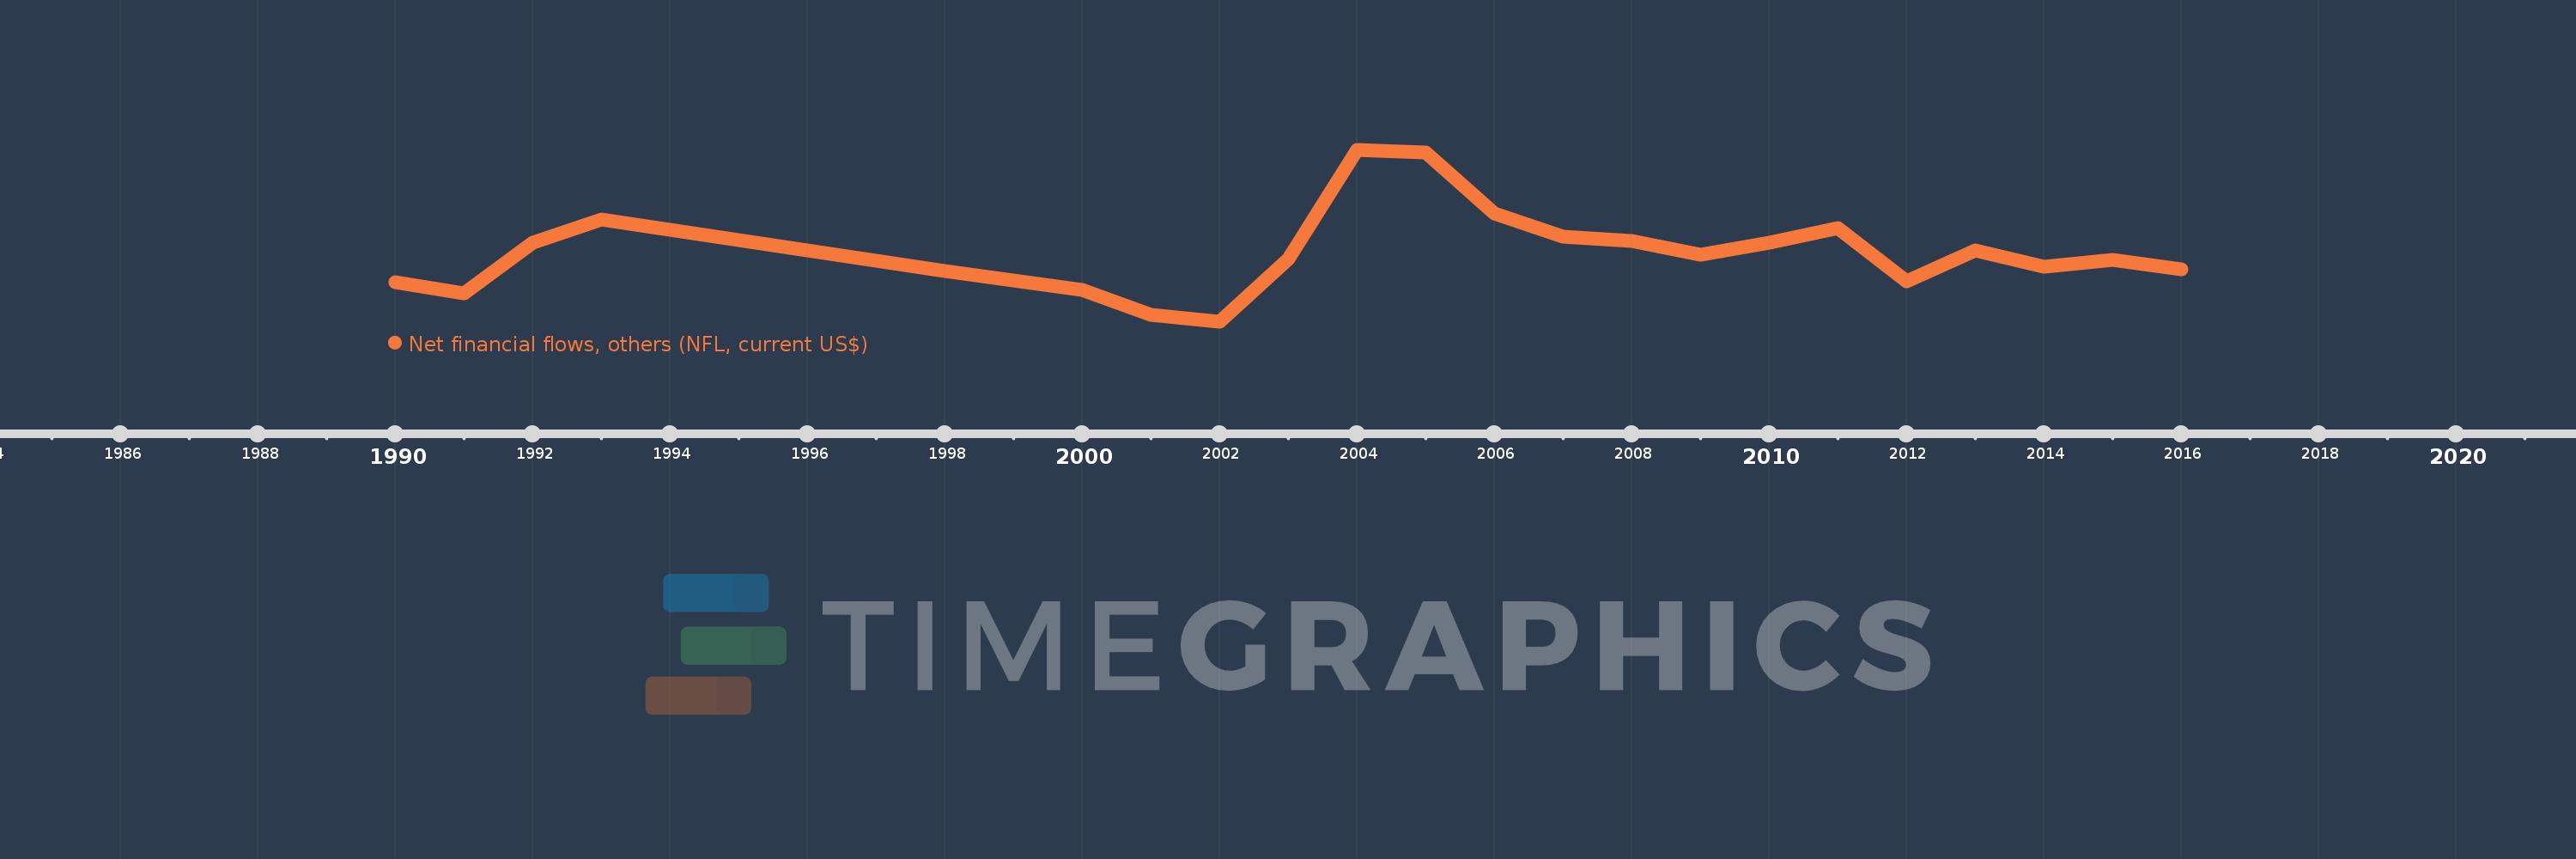
Questa scala temporale mostra un grafico dal 1990 anno al 2016 anno. Angola. I dati fino ad 1989 anno non disponibili. Il numero di osservazioni attuali secondo i date: 22.
La fonte (nome):
Indicatori dello sviluppo mondiale
La fonte (organizzazione):
World Bank, International Debt Statistics.
Categorie:
External Debt
sono stati aggiornati
23 apr 2017 anni
Indicatori delle variazioni dei valori per anni
In media:
216.773 Mille.
Minima:
-2.643 Mln
1 gen 2002 anni
Massimo:
4.367 Mln
1 gen 2004 anni
Alla data di osservazione
Valore
Variazione assoluta
La variazione rispetto al valore precedente
1 gen 1990 anni
-1.016 Mln
-1.016 Mln
0.0%
1 gen 1991 anni
-1.468 Mln
-452.0 Mille.
44.49%
1 gen 1992 anni
588.0 Mille.
+2.056 Mln
-140.05%
1 gen 1993 anni
1.534 Mln
+946.0 Mille.
160.88%
1 gen 1998 anni
-572.0 Mille.
-2.106 Mln
-137.29%
1 gen 2000 anni
-1.338 Mln
-766.0 Mille.
133.92%
1 gen 2001 anni
-2.357 Mln
-1.019 Mln
76.16%
1 gen 2002 anni
-2.643 Mln
-286.0 Mille.
12.13%
1 gen 2003 anni
-67.0 Mille.
+2.576 Mln
-97.47%
1 gen 2004 anni
4.367 Mln
+4.434 Mln
-6.62 Mille.%
1 gen 2005 anni
4.278 Mln
-89.0 Mille.
-2.04%
1 gen 2006 anni
1.788 Mln
-2.49 Mln
-58.2%
1 gen 2007 anni
829.0 Mille.
-959.0 Mille.
-53.64%
1 gen 2008 anni
658.0 Mille.
-171.0 Mille.
-20.63%
1 gen 2009 anni
112.0 Mille.
-546.0 Mille.
-82.98%
1 gen 2010 anni
577.0 Mille.
+465.0 Mille.
415.18%
1 gen 2011 anni
1.195 Mln
+618.0 Mille.
107.11%
1 gen 2012 anni
-983.0 Mille.
-2.178 Mln
-182.26%
1 gen 2013 anni
273.0 Mille.
+1.256 Mln
-127.77%
1 gen 2014 anni
-372.0 Mille.
-645.0 Mille.
-236.26%
1 gen 2015 anni
-107.0 Mille.
+265.0 Mille.
-71.24%
1 gen 2016 anni
-507.0 Mille.
-400.0 Mille.
373.83%
Classificazione dei paesi secondo i statistiche attuali per anni