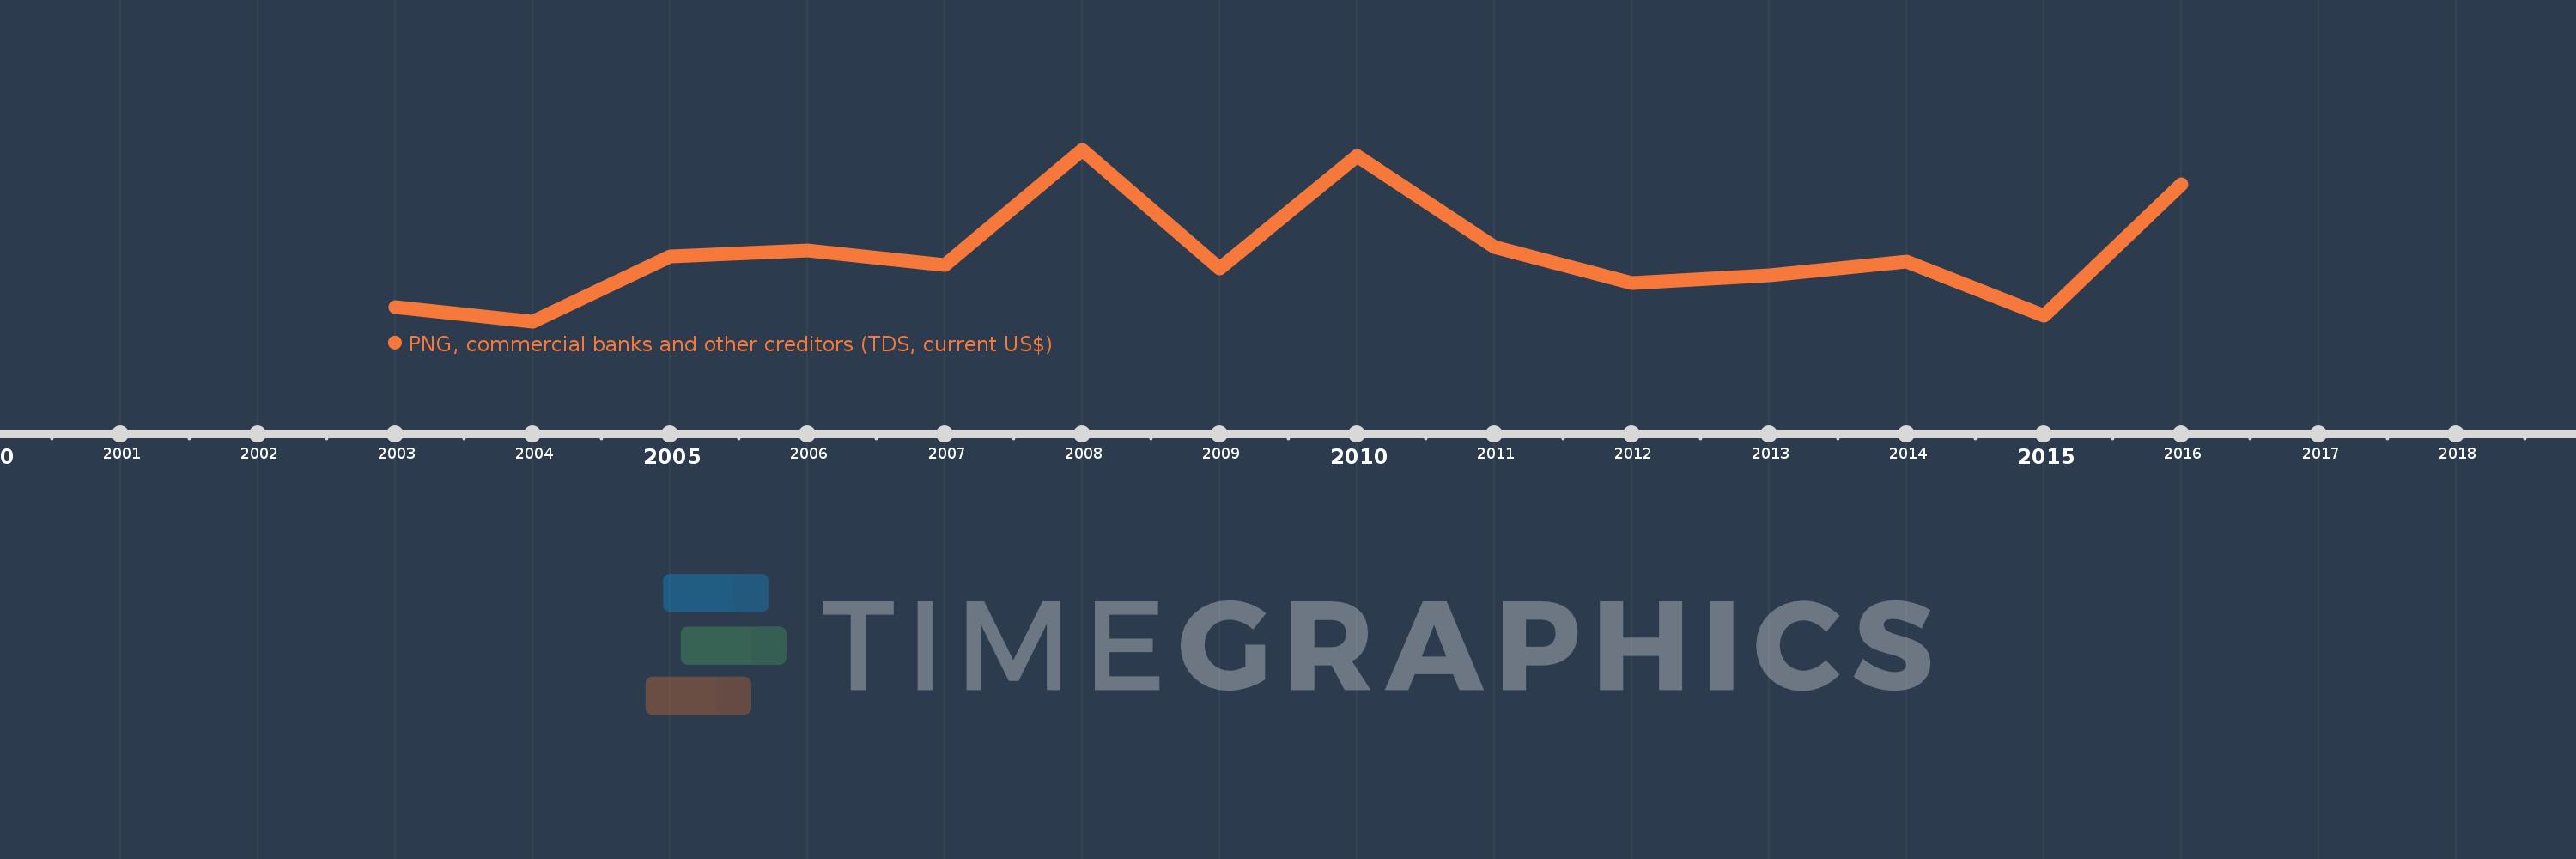
Questa scala temporale mostra un grafico dal 2003 anno al 2016 anno. Algeria. I dati fino ad 2002 anno non disponibili. Il numero di osservazioni attuali secondo i date: 14.
La fonte (nome):
Indicatori dello sviluppo mondiale
La fonte (organizzazione):
World Bank, International Debt Statistics.
Categorie:
External Debt
sono stati aggiornati
23 apr 2017 anni
Indicatori delle variazioni dei valori per anni
In media:
244.317 Mln
Minima:
13.774 Mln
1 gen 2004 anni
Massimo:
588.3 Mln
1 gen 2008 anni
Alla data di osservazione
Valore
Variazione assoluta
La variazione rispetto al valore precedente
1 gen 2003 anni
64.627 Mln
+64.627 Mln
0.0%
1 gen 2004 anni
13.774 Mln
-50.853 Mln
-78.69%
1 gen 2005 anni
232.913 Mln
+219.139 Mln
1.59 Mille.%
1 gen 2006 anni
254.055 Mln
+21.142 Mln
9.08%
1 gen 2007 anni
204.133 Mln
-49.922 Mln
-19.65%
1 gen 2008 anni
588.3 Mln
+384.167 Mln
188.19%
1 gen 2009 anni
191.45 Mln
-396.85 Mln
-67.46%
1 gen 2010 anni
570.39 Mln
+378.94 Mln
197.93%
1 gen 2011 anni
264.02 Mln
-306.37 Mln
-53.71%
1 gen 2012 anni
143.39 Mln
-120.63 Mln
-45.69%
1 gen 2013 anni
170.95 Mln
+27.56 Mln
19.22%
1 gen 2014 anni
215.44 Mln
+44.49 Mln
26.03%
1 gen 2015 anni
33.52 Mln
-181.92 Mln
-84.44%
1 gen 2016 anni
473.47 Mln
+439.95 Mln
1.31 Mille.%
Classificazione dei paesi secondo i statistiche attuali per anni