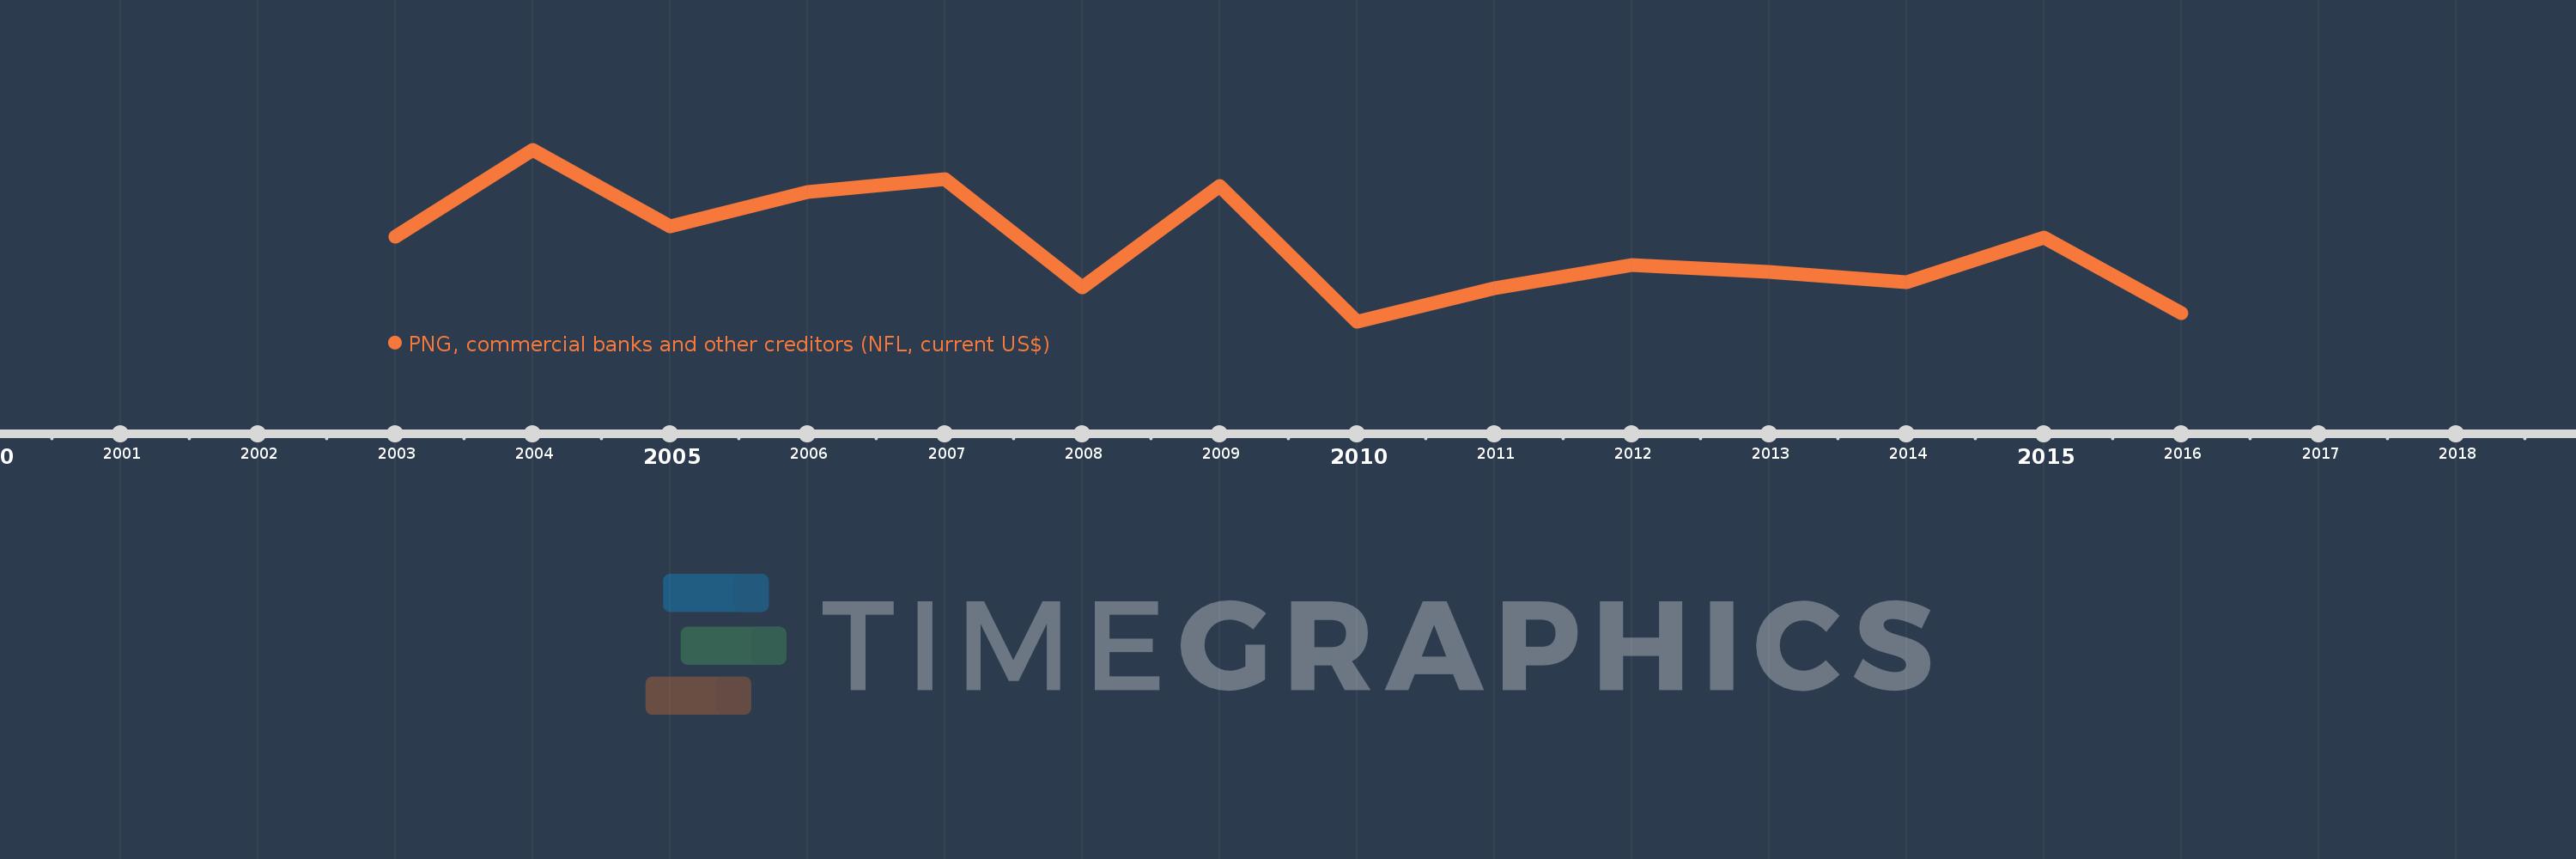
Questa scala temporale mostra un grafico dal 2003 anno al 2016 anno. Algeria. I dati fino ad 2002 anno non disponibili. Il numero di osservazioni attuali secondo i date: 14.
La fonte (nome):
Indicatori dello sviluppo mondiale
La fonte (organizzazione):
World Bank, International Debt Statistics.
Categorie:
External Debt
sono stati aggiornati
23 apr 2017 anni
Indicatori delle variazioni dei valori per anni
In media:
-25.165 Mln
Minima:
-398.38 Mln
1 gen 2010 anni
Massimo:
439.642 Mln
1 gen 2004 anni
Alla data di osservazione
Valore
Variazione assoluta
La variazione rispetto al valore precedente
1 gen 2003 anni
16.966 Mln
+16.966 Mln
0.0%
1 gen 2004 anni
439.642 Mln
+422.676 Mln
2.49 Mille.%
1 gen 2005 anni
69.13 Mln
-370.512 Mln
-84.28%
1 gen 2006 anni
234.104 Mln
+164.974 Mln
238.64%
1 gen 2007 anni
300.093 Mln
+65.989 Mln
28.19%
1 gen 2008 anni
-227.92 Mln
-528.013 Mln
-175.95%
1 gen 2009 anni
263.65 Mln
+491.57 Mln
-215.68%
1 gen 2010 anni
-398.38 Mln
-662.03 Mln
-251.1%
1 gen 2011 anni
-231.79 Mln
+166.59 Mln
-41.82%
1 gen 2012 anni
-120.66 Mln
+111.13 Mln
-47.94%
1 gen 2013 anni
-152.42 Mln
-31.76 Mln
26.32%
1 gen 2014 anni
-202.64 Mln
-50.22 Mln
32.95%
1 gen 2015 anni
14.75 Mln
+217.39 Mln
-107.28%
1 gen 2016 anni
-356.83 Mln
-371.58 Mln
-2.52 Mille.%
Classificazione dei paesi secondo i statistiche attuali per anni