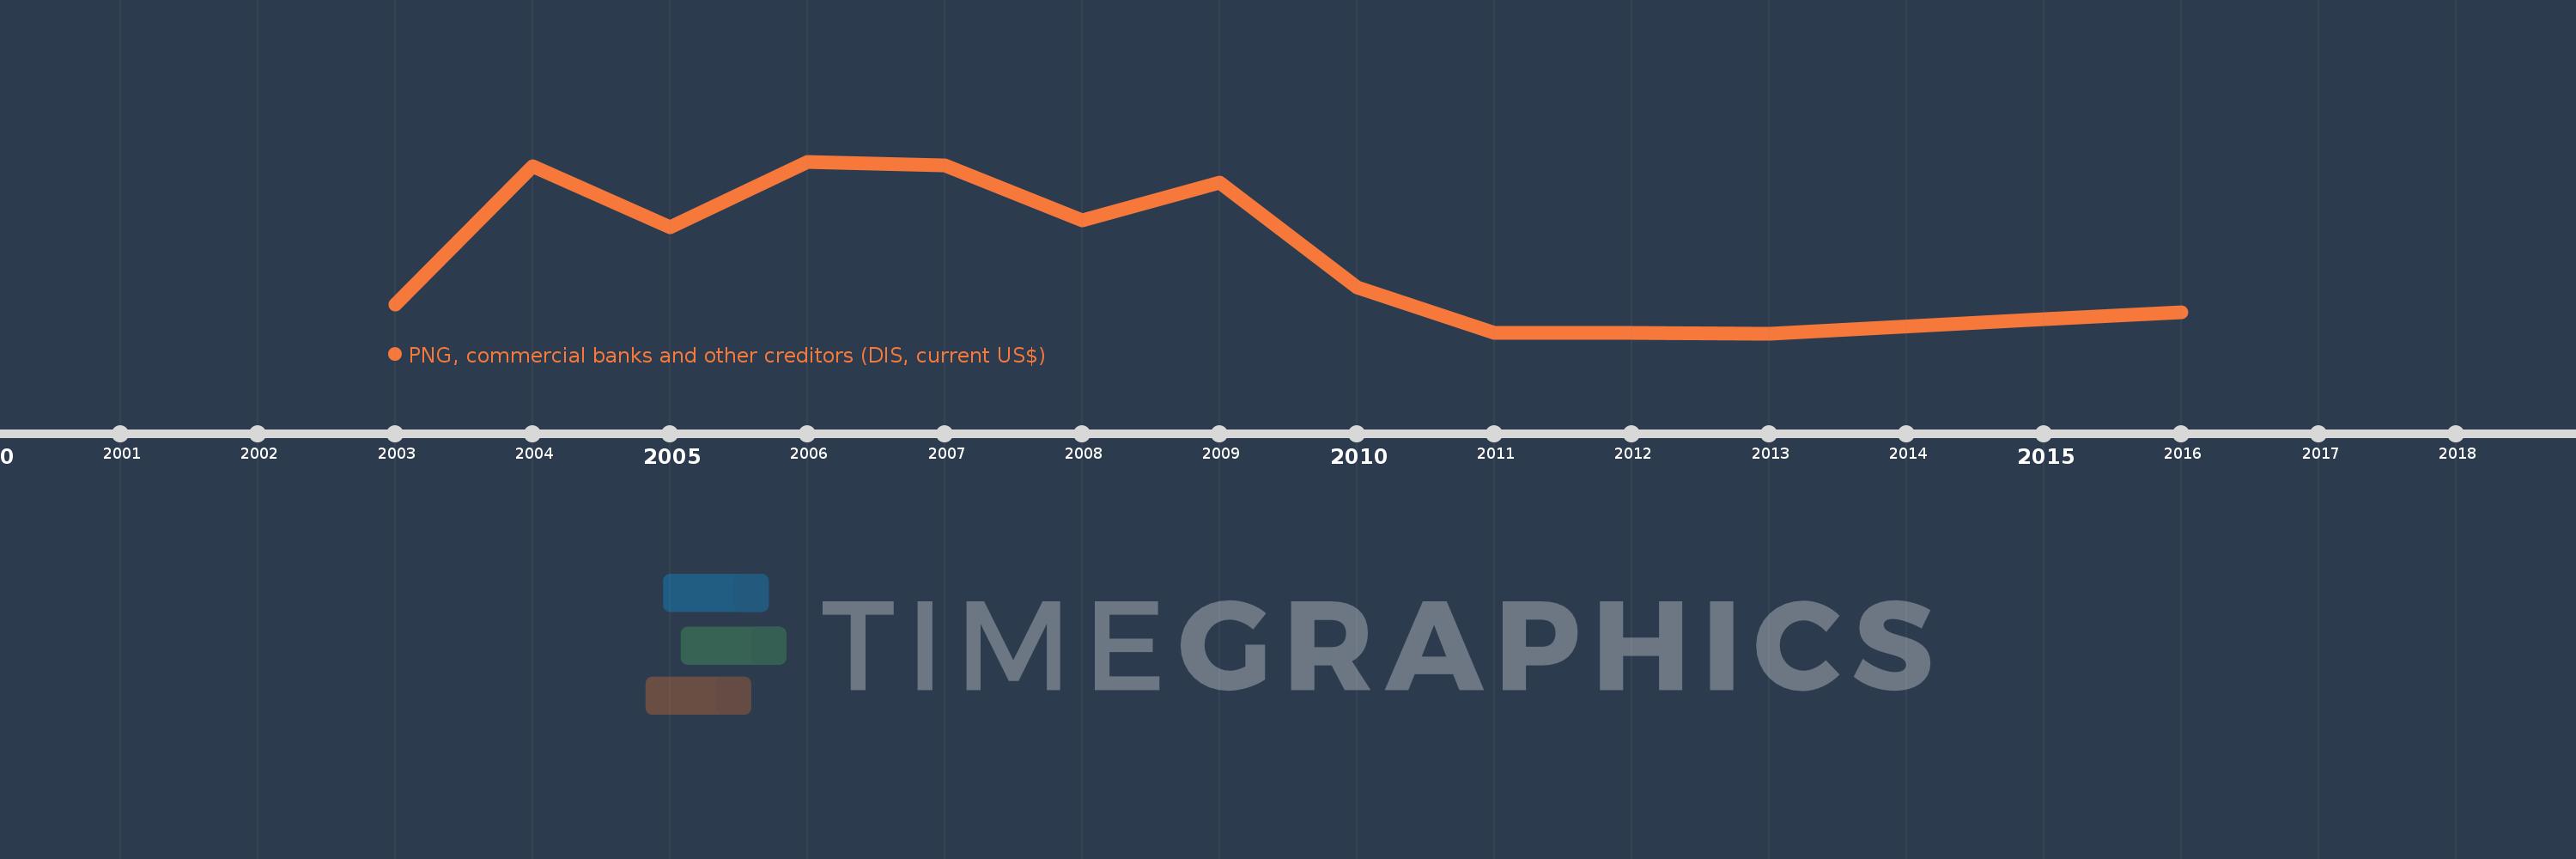
Questa scala temporale mostra un grafico dal 2003 anno al 2016 anno. Algeria. I dati fino ad 2002 anno non disponibili. Il numero di osservazioni attuali secondo i date: 13.
La fonte (nome):
Indicatori dello sviluppo mondiale
La fonte (organizzazione):
World Bank, International Debt Statistics.
Categorie:
External Debt
sono stati aggiornati
23 apr 2017 anni
Indicatori delle variazioni dei valori per anni
In media:
204.618 Mln
Minima:
230.0 Mille.
1 gen 2013 anni
Massimo:
462.859 Mln
1 gen 2006 anni
Alla data di osservazione
Valore
Variazione assoluta
La variazione rispetto al valore precedente
1 gen 2003 anni
77.009 Mln
+77.009 Mln
0.0%
1 gen 2004 anni
450.78 Mln
+373.771 Mln
485.36%
1 gen 2005 anni
284.797 Mln
-165.983 Mln
-36.82%
1 gen 2006 anni
462.859 Mln
+178.062 Mln
62.52%
1 gen 2007 anni
451.458 Mln
-11.401 Mln
-2.46%
1 gen 2008 anni
303.61 Mln
-147.848 Mln
-32.75%
1 gen 2009 anni
407.3 Mln
+103.69 Mln
34.15%
1 gen 2010 anni
123.45 Mln
-283.85 Mln
-69.69%
1 gen 2011 anni
1.72 Mln
-121.73 Mln
-98.61%
1 gen 2012 anni
240.0 Mille.
-1.48 Mln
-86.05%
1 gen 2013 anni
230.0 Mille.
-10.0 Mille.
-4.17%
1 gen 2015 anni
38.81 Mln
+38.58 Mln
16.77 Mille.%
1 gen 2016 anni
57.77 Mln
+18.96 Mln
48.85%
Classificazione dei paesi secondo i statistiche attuali per anni