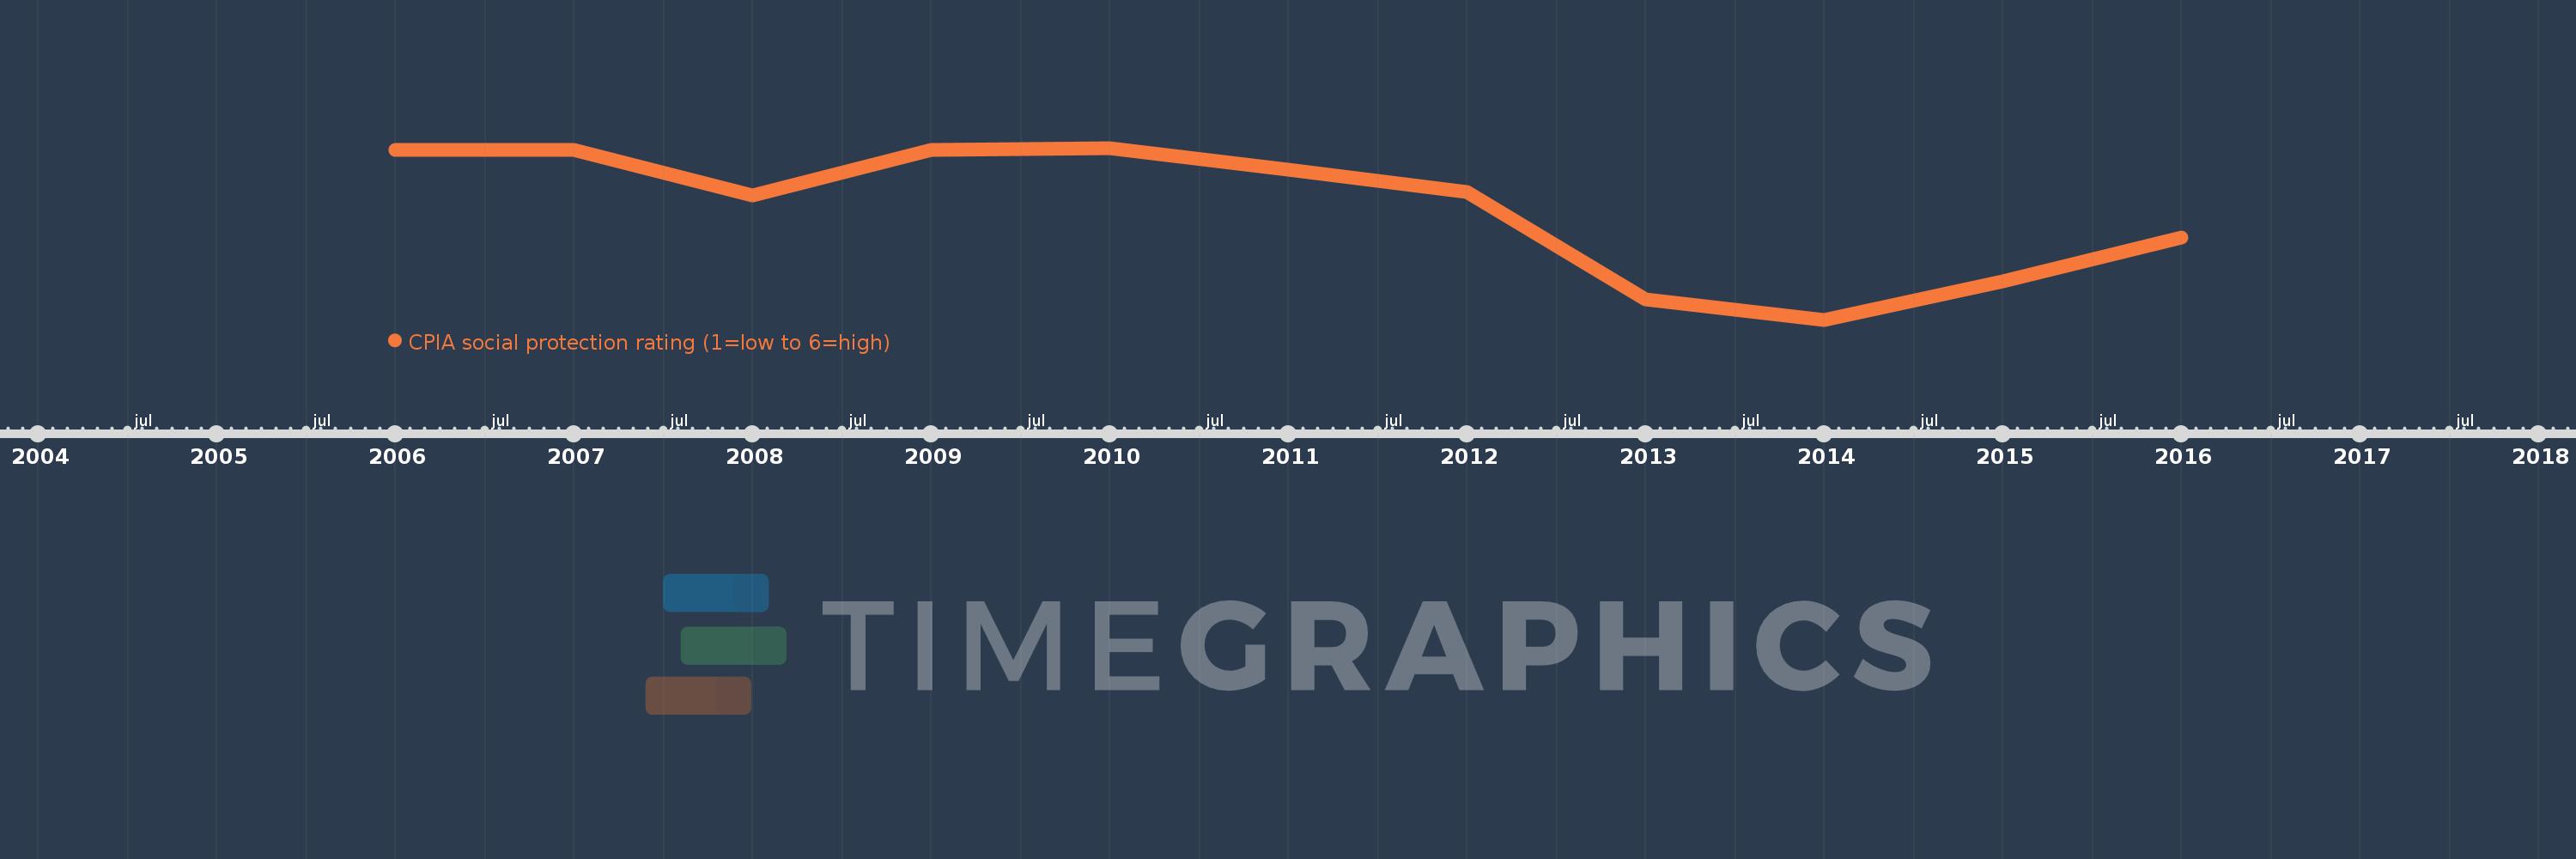
Questa scala temporale mostra un grafico dal 2006 anno al 2016 anno. Sub-Saharan Africa (excluding high income). I dati fino ad 2005 anno non disponibili. Il numero di osservazioni attuali secondo i date: 11.
La fonte (nome):
Indicatori dello sviluppo mondiale
La fonte (organizzazione):
World Bank Group, CPIA database (http://www.worldbank.org/ida).
Categorie:
Public Sector
sono stati aggiornati
23 apr 2017 anni
Indicatori delle variazioni dei valori per anni
In media:
2.951
Minima:
2.885
1 gen 2014 anni
Massimo:
2.987
1 gen 2010 anni
Alla data di osservazione
Valore
Variazione assoluta
La variazione rispetto al valore precedente
1 gen 2006 anni
2.986
+2.986
0.0%
1 gen 2007 anni
2.986
0.0
-0.01%
1 gen 2008 anni
2.959
-0.027
-0.89%
1 gen 2009 anni
2.986
+0.027
0.91%
1 gen 2010 anni
2.987
+0.0
0.01%
1 gen 2011 anni
2.974
-0.013
-0.44%
1 gen 2012 anni
2.961
-0.013
-0.44%
1 gen 2013 anni
2.897
-0.063
-2.13%
1 gen 2014 anni
2.885
-0.013
-0.44%
1 gen 2015 anni
2.908
+0.023
0.81%
1 gen 2016 anni
2.934
+0.026
0.9%
Classificazione dei paesi secondo i statistiche attuali per anni