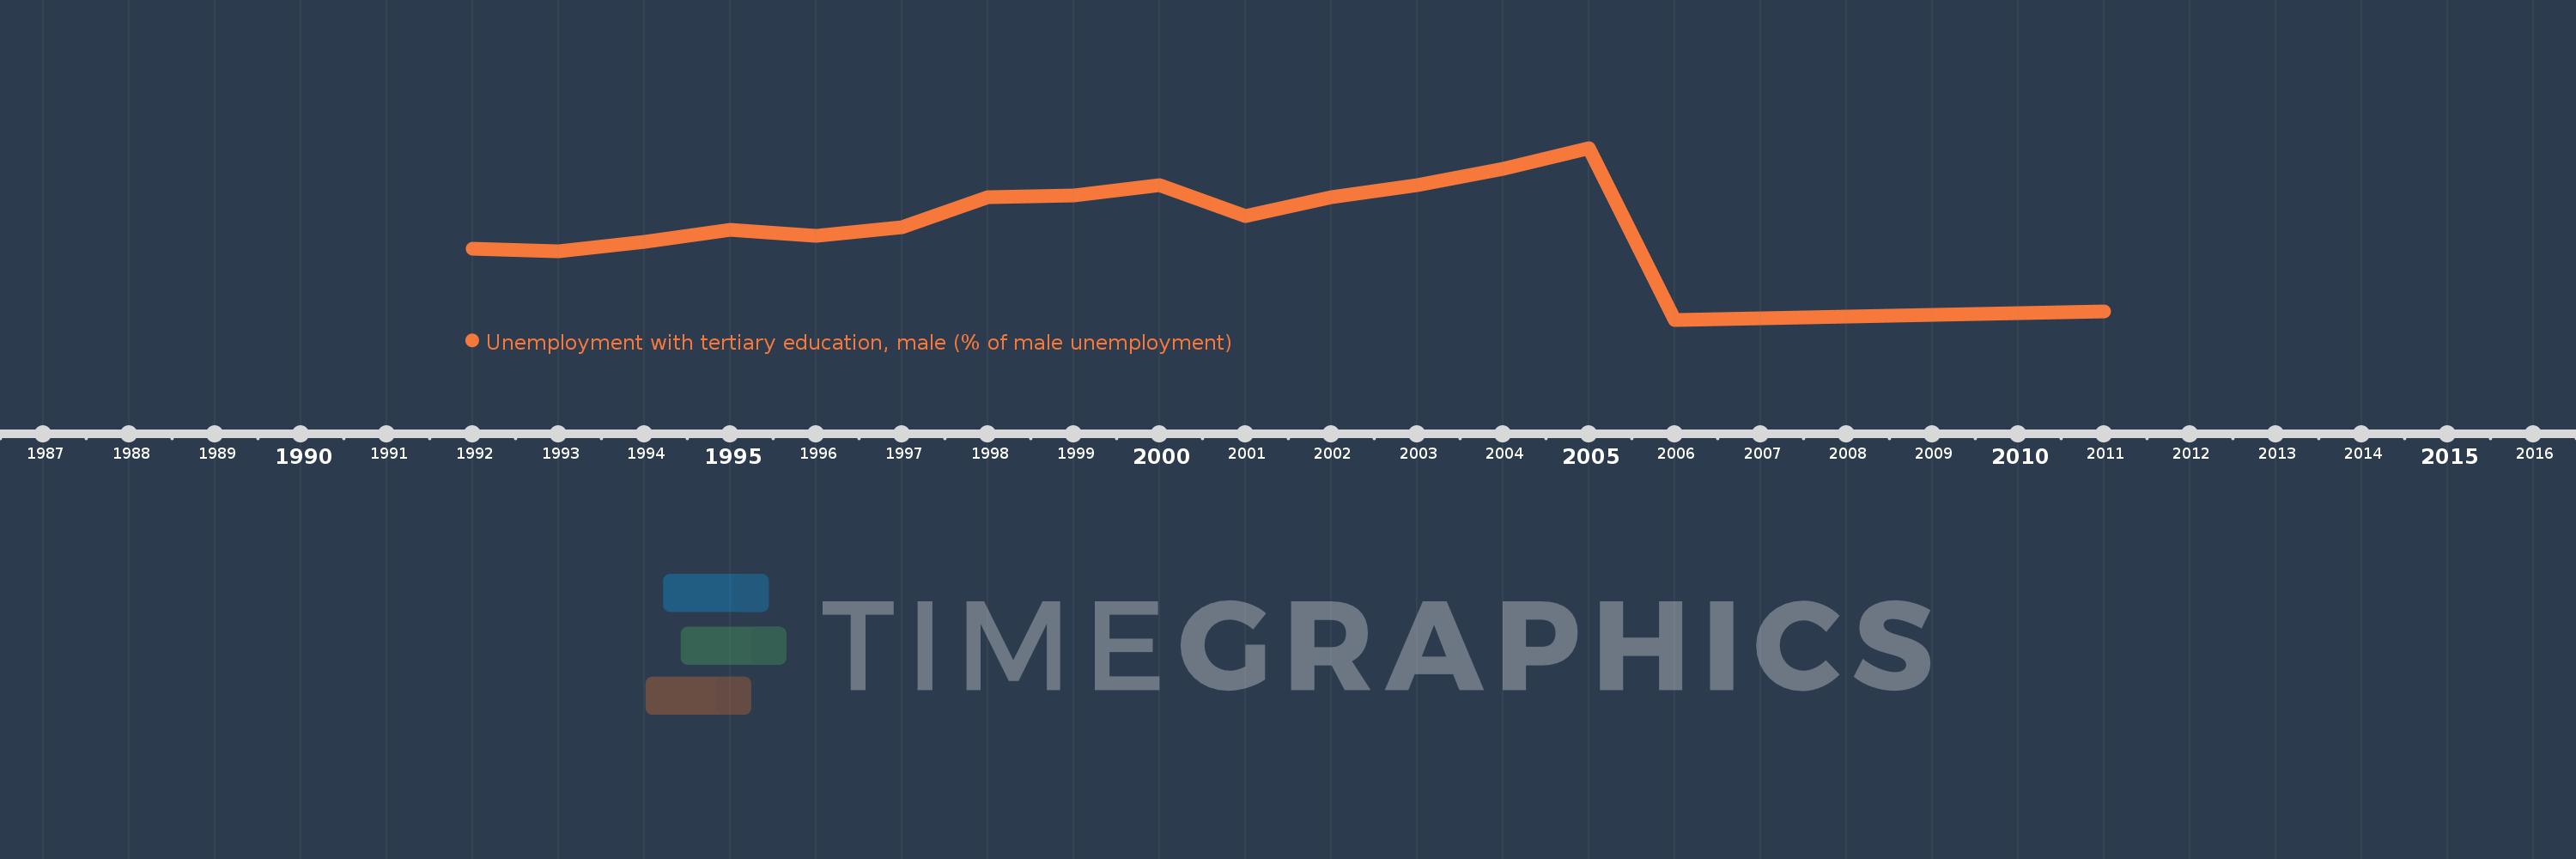
Questa scala temporale mostra un grafico dal 1992 anno al 2011 anno. South Asia (IDA & IBRD). I dati fino ad 1991 anno non disponibili. Il numero di osservazioni attuali secondo i date: 16.
La fonte (nome):
Indicatori dello sviluppo mondiale
La fonte (organizzazione):
International Labour Organization, Key Indicators of the Labour Market database.
Categorie:
Social Protection & Labor, Gender
sono stati aggiornati
23 apr 2017 anni
Indicatori delle variazioni dei valori per anni
In media:
26.425
Minima:
19.658
1 gen 2006 anni
Massimo:
31.614
1 gen 2005 anni
Alla data di osservazione
Valore
Variazione assoluta
La variazione rispetto al valore precedente
1 gen 1992 anni
24.6
+24.6
0.0%
1 gen 1993 anni
24.4
-0.2
-0.81%
1 gen 1994 anni
25.1
+0.7
2.87%
1 gen 1995 anni
25.9
+0.8
3.19%
1 gen 1996 anni
25.499
-0.401
-1.55%
1 gen 1997 anni
26.102
+0.603
2.37%
1 gen 1998 anni
28.2
+2.098
8.04%
1 gen 1999 anni
28.3
+0.1
0.35%
1 gen 2000 anni
29.0
+0.7
2.47%
1 gen 2001 anni
26.852
-2.148
-7.41%
1 gen 2002 anni
28.202
+1.35
5.03%
1 gen 2003 anni
29.007
+0.805
2.85%
1 gen 2004 anni
30.135
+1.129
3.89%
1 gen 2005 anni
31.614
+1.479
4.91%
1 gen 2006 anni
19.658
-11.956
-37.82%
1 gen 2011 anni
20.224
+0.566
2.88%
Classificazione dei paesi secondo i statistiche attuali per anni