29
/it/
it
AIzaSyAYiBZKx7MnpbEhh9jyipgxe19OcubqV5w
April 1, 2024
54445
Pacific island small states
PSS
false
2
1
Stocks traded, turnover ratio of domestic shares (%)
2013,2012,2011,2010,2009,2008,2007,2006,2005,2004,2000,1999,1998
Download
Biblioteca di statistiche globali →Pacific island small states →

Stocks traded, turnover ratio of domestic shares (%)

Queste statistiche in altri paesi:
Arab WorldArgentinaArmeniaAustraliaAustriaBahrainBangladeshBarbadosBelgiumBermudaBoliviaBotswanaBrazilBulgariaCanadaCaribbean small statesCayman IslandsCentral Europe and the BalticsChannel IslandsChileChinaColombiaCosta RicaCote d'IvoireCroatiaCyprusCzech RepublicDenmarkEarly-demographic dividendEast Asia & PacificEast Asia & Pacific (excluding high income)East Asia & Pacific (IDA & IBRD countries)EcuadorEgypt, Arab Rep.El SalvadorEuro areaEurope & Central AsiaEurope & Central Asia (excluding high income)Europe & Central Asia (IDA & IBRD countries)European UnionFijiFinlandFragile and conflict affected situationsFranceGeorgiaGermanyGhanaGreeceGuyanaHeavily indebted poor countries (HIPC)High incomeHong Kong SAR, ChinaHungaryIBRD onlyIDA & IBRD totalIDA blendIDA onlyIDA totalIndiaIndonesiaIran, Islamic Rep.IrelandIsraelItalyJamaicaJapanJordanKazakhstanKenyaKorea, Rep.KuwaitKyrgyz RepublicLate-demographic dividendLatin America & Caribbean Latin America & Caribbean (excluding high income)Latin America & the Caribbean (IDA & IBRD countries)Least developed countries: UN classificationLebanonLow & middle incomeLow incomeLower middle incomeLuxembourgMacedonia, FYRMalawiMalaysiaMaltaMauritiusMexicoMiddle East & North AfricaMiddle East & North Africa (excluding high income)Middle East & North Africa (IDA & IBRD countries)Middle incomeMoldovaMongoliaMontenegroMoroccoNamibiaNetherlandsNew ZealandNigeriaNorth AmericaNorwayOECD membersOmanOther small statesPacific island small statesPakistanPanamaPapua New GuineaParaguayPeruPhilippinesPolandPortugalPost-demographic dividendPre-demographic dividendQatarRomaniaRussian FederationSaudi ArabiaSerbiaSingaporeSlovak RepublicSloveniaSmall statesSouth AfricaSouth AsiaSouth Asia (IDA & IBRD)SpainSri LankaSt. Kitts and NevisSub-Saharan Africa Sub-Saharan Africa (excluding high income)Sub-Saharan Africa (IDA & IBRD countries)SwazilandSwedenSwitzerlandTanzaniaThailandTrinidad and TobagoTunisiaTurkeyUgandaUkraineUnited Arab EmiratesUnited KingdomUnited StatesUpper middle incomeUruguayUzbekistanVenezuela, RBVietnamWest Bank and GazaWorldZambiaZimbabwe
Linea del tempo:
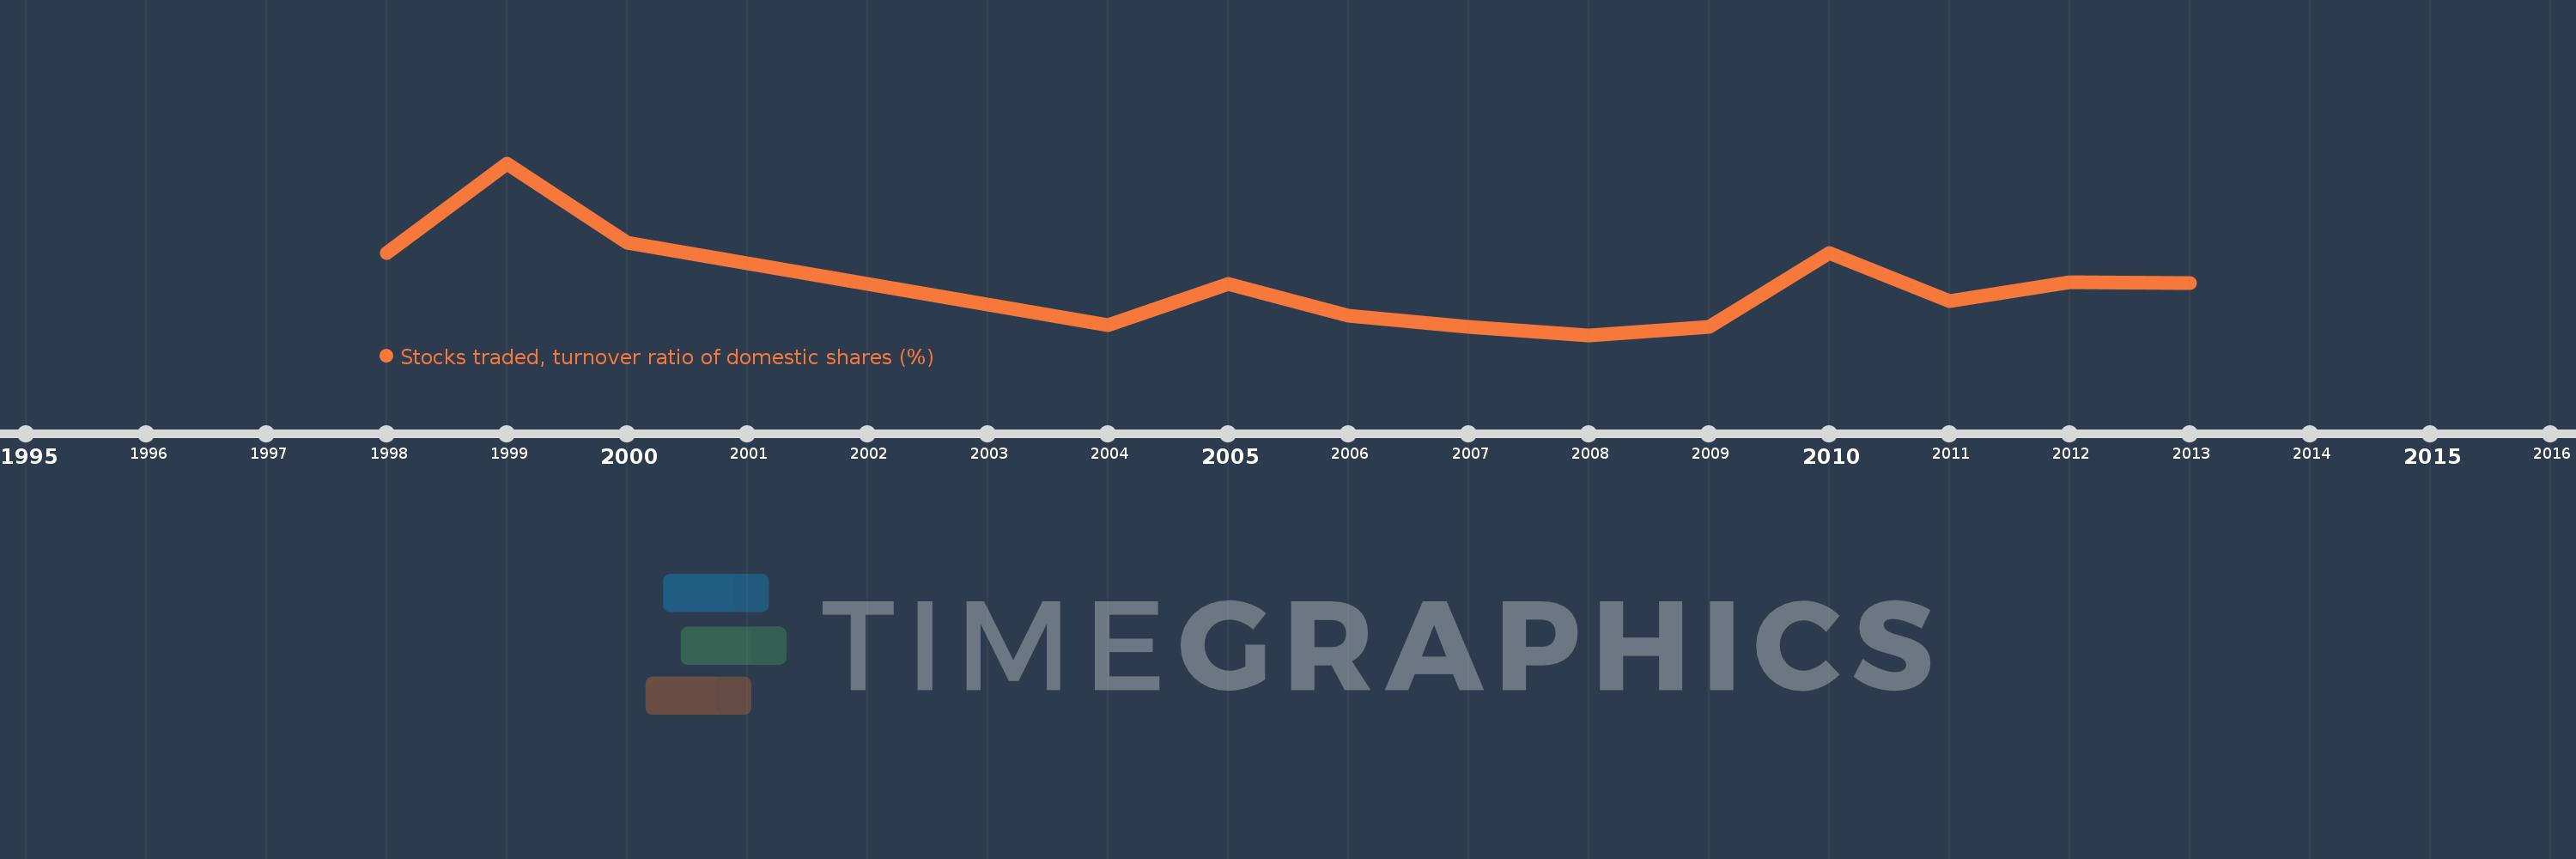
Questa scala temporale mostra un grafico dal 1998 anno al 2013 anno. Pacific island small states. I dati fino ad 1997 anno non disponibili. Il numero di osservazioni attuali secondo i date: 13.
La fonte (nome):
Indicatori dello sviluppo mondiale
La fonte (organizzazione):
World Federation of Exchanges database.
Categorie:
Financial Sector
sono stati aggiornati
23 apr 2017 anni
Indicatori delle variazioni dei valori per anni
In media:
1.552
Minima:
0.345
1 gen 2008 anni
Massimo:
4.42
1 gen 1999 anni
Alla data di osservazione
Valore
Variazione assoluta
La variazione rispetto al valore precedente
1 gen 1998 anni
2.286
+2.286
0.0%
1 gen 1999 anni
4.42
+2.134
93.37%
1 gen 2000 anni
2.544
-1.876
-42.44%
1 gen 2004 anni
0.571
-1.973
-77.54%
1 gen 2005 anni
1.55
+0.979
171.32%
1 gen 2006 anni
0.795
-0.755
-48.7%
1 gen 2007 anni
0.534
-0.262
-32.89%
1 gen 2008 anni
0.345
-0.188
-35.31%
1 gen 2009 anni
0.53
+0.185
53.56%
1 gen 2010 anni
2.295
+1.765
333.07%
1 gen 2011 anni
1.154
-1.142
-49.74%
1 gen 2012 anni
1.589
+0.435
37.72%
1 gen 2013 anni
1.568
-0.021
-1.31%
Classificazione dei paesi secondo i statistiche attuali per anni

Commenti:

Inviare
PremiumAbout & FeedbackAccordoPrivatezza
logo
© 2022 Selected Technologies LLC – Morgan Hill, California