29
/it/
it
AIzaSyAYiBZKx7MnpbEhh9jyipgxe19OcubqV5w
April 1, 2024
53040
OECD members
OED
false
2
1
Self-employed, total (% of total employment)
2014,2013,2012,2011,2010,2009,2008,2007,2006,2005,2004,2003,2002,2001,2000,1999,1998,1997,1996,1995,1994,1993,1992
Download
Biblioteca di statistiche globali →OECD members →

Self-employed, total (% of total employment)

Queste statistiche in altri paesi:
AlbaniaAlgeriaAmerican SamoaAngolaAntigua and BarbudaArgentinaArmeniaArubaAustraliaAustriaAzerbaijanBahamas, TheBahrainBangladeshBarbadosBelarusBelgiumBelizeBeninBermudaBhutanBoliviaBosnia and HerzegovinaBotswanaBrazilBritish Virgin IslandsBrunei DarussalamBulgariaBurkina FasoBurundiCabo VerdeCambodiaCameroonCanadaCaribbean small statesCayman IslandsCentral Europe and the BalticsChadChileColombiaCongo, Rep.Costa RicaCote d'IvoireCroatiaCubaCyprusCzech RepublicDenmarkDjiboutiDominicaDominican RepublicEarly-demographic dividendEcuadorEgypt, Arab Rep.El SalvadorEquatorial GuineaEstoniaEthiopiaEuro areaEurope & Central AsiaEurope & Central Asia (excluding high income)Europe & Central Asia (IDA & IBRD countries)European UnionFijiFinlandFranceFrench PolynesiaGabonGambia, TheGeorgiaGermanyGhanaGreeceGrenadaGuamGuatemalaGuineaGuyanaHaitiHigh incomeHondurasHong Kong SAR, ChinaHungaryIcelandIndiaIndonesiaIran, Islamic Rep.IrelandIsle of ManIsraelItalyJamaicaJapanJordanKazakhstanKenyaKiribatiKorea, Rep.KosovoKuwaitKyrgyz RepublicLao PDRLatin America & Caribbean Latin America & Caribbean (excluding high income)Latin America & the Caribbean (IDA & IBRD countries)LatviaLebanonLesothoLiberiaLithuaniaLower middle incomeLuxembourgMacao SAR, ChinaMacedonia, FYRMadagascarMalawiMalaysiaMaldivesMaliMaltaMarshall IslandsMauritiusMexicoMiddle East & North AfricaMiddle East & North Africa (excluding high income)Middle East & North Africa (IDA & IBRD countries)MoldovaMongoliaMontenegroMoroccoMozambiqueNamibiaNepalNetherlandsNew CaledoniaNew ZealandNicaraguaNigerNorth AmericaNorwayOECD membersOmanPakistanPanamaParaguayPeruPhilippinesPolandPortugalPost-demographic dividendPuerto RicoQatarRomaniaRussian FederationRwandaSamoaSan MarinoSao Tome and PrincipeSaudi ArabiaSenegalSerbiaSeychellesSierra LeoneSingaporeSlovak RepublicSloveniaSouth AfricaSouth AsiaSouth Asia (IDA & IBRD)SpainSri LankaSt. Kitts and NevisSt. LuciaSt. Vincent and the GrenadinesSurinameSwazilandSwedenSwitzerlandSyrian Arab RepublicTajikistanTanzaniaThailandTogoTongaTrinidad and TobagoTunisiaTurkeyTurks and Caicos IslandsTuvaluUgandaUkraineUnited Arab EmiratesUnited KingdomUnited StatesUruguayVanuatuVenezuela, RBVietnamWest Bank and GazaYemen, Rep.ZambiaZimbabwe
Linea del tempo:
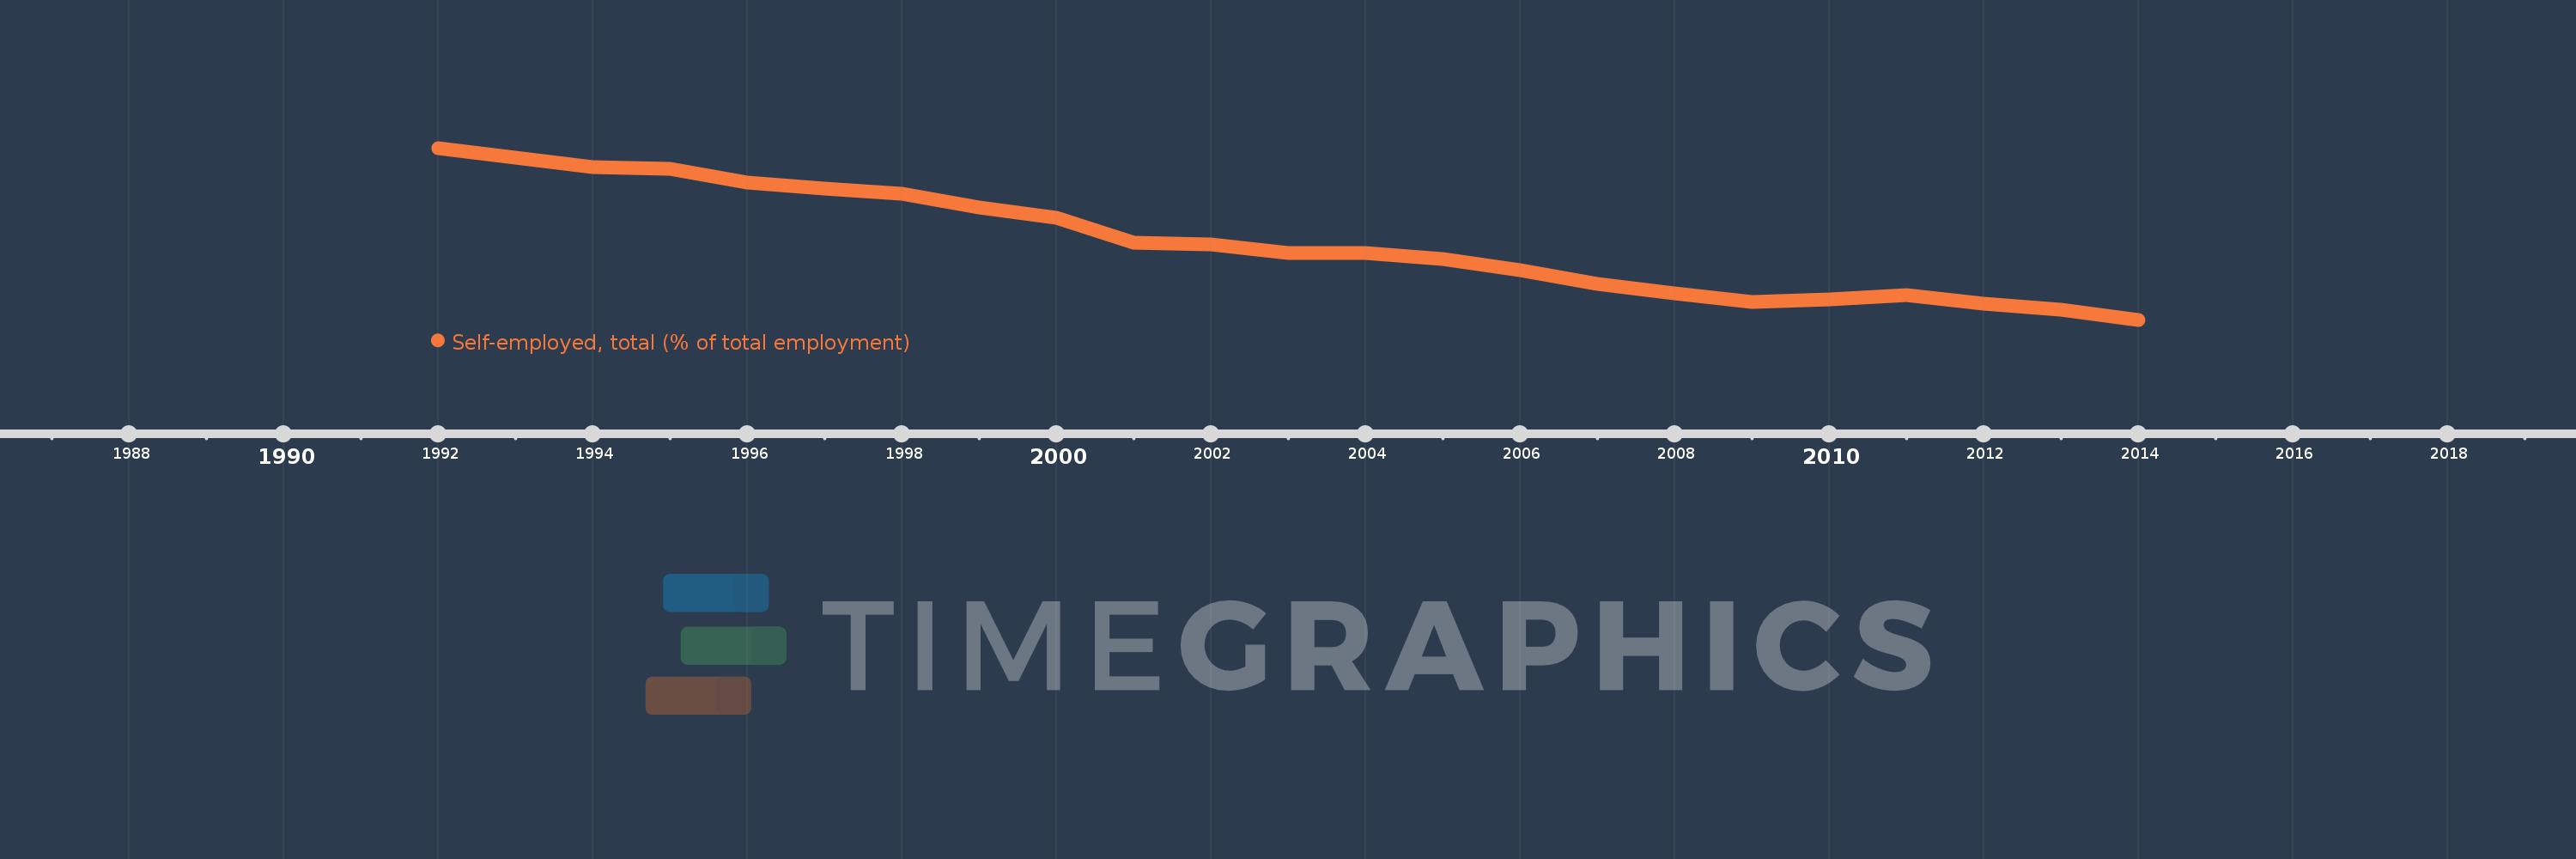
Questa scala temporale mostra un grafico dal 1992 anno al 2014 anno. OECD members. I dati fino ad 1991 anno non disponibili. Il numero di osservazioni attuali secondo i date: 23.
La fonte (nome):
Indicatori dello sviluppo mondiale
La fonte (organizzazione):
International Labour Organization, Key Indicators of the Labour Market database.
Categorie:
Social Protection & Labor
sono stati aggiornati
23 apr 2017 anni
Indicatori delle variazioni dei valori per anni
In media:
17.676
Minima:
15.542
1 gen 2014 anni
Massimo:
20.246
1 gen 1992 anni
Alla data di osservazione
Valore
Variazione assoluta
La variazione rispetto al valore precedente
1 gen 1992 anni
20.246
+20.246
0.0%
1 gen 1993 anni
19.982
-0.264
-1.3%
1 gen 1994 anni
19.71
-0.272
-1.36%
1 gen 1995 anni
19.686
-0.024
-0.12%
1 gen 1996 anni
19.307
-0.379
-1.92%
1 gen 1997 anni
19.135
-0.173
-0.89%
1 gen 1998 anni
19.004
-0.13
-0.68%
1 gen 1999 anni
18.62
-0.385
-2.02%
1 gen 2000 anni
18.323
-0.297
-1.59%
1 gen 2001 anni
17.651
-0.672
-3.67%
1 gen 2002 anni
17.599
-0.052
-0.3%
1 gen 2003 anni
17.371
-0.228
-1.29%
1 gen 2004 anni
17.376
+0.004
0.03%
1 gen 2005 anni
17.207
-0.169
-0.97%
1 gen 2006 anni
16.892
-0.315
-1.83%
1 gen 2007 anni
16.526
-0.366
-2.17%
1 gen 2008 anni
16.255
-0.27
-1.64%
1 gen 2009 anni
16.022
-0.234
-1.44%
1 gen 2010 anni
16.098
+0.076
0.47%
1 gen 2011 anni
16.21
+0.113
0.7%
1 gen 2012 anni
15.973
-0.237
-1.46%
1 gen 2013 anni
15.812
-0.161
-1.01%
1 gen 2014 anni
15.542
-0.27
-1.71%
Classificazione dei paesi secondo i statistiche attuali per anni

Commenti:

Inviare
PremiumAbout & FeedbackAccordoPrivatezza
logo
© 2022 Selected Technologies LLC – Morgan Hill, California