30
/it/
AIzaSyAYiBZKx7MnpbEhh9jyipgxe19OcubqV5w
April 1, 2024
50274
Middle East & North Africa (IDA & IBRD countries)
TMN
false
2
1
Net bilateral aid flows from DAC donors, Slovak Republic (current US$)
2015,2014,2013,2012,2010,2009,2006
Download
Biblioteca di statistiche globali →Middle East & North Africa (IDA & IBRD countries) →

Net bilateral aid flows from DAC donors, Slovak Republic (current US$)

Queste statistiche in altri paesi:

AfghanistanAlbaniaAngolaArab WorldArmeniaAzerbaijanBangladeshBelarusBeninBosnia and HerzegovinaBrazilBurundiCambodiaCentral Europe and the BalticsChileChinaColombiaCosta RicaCroatiaCubaEast Asia & PacificEast Asia & Pacific (excluding high income)East Asia & Pacific (IDA & IBRD countries)EcuadorEgypt, Arab Rep.EthiopiaEurope & Central AsiaEurope & Central Asia (excluding high income)Europe & Central Asia (IDA & IBRD countries)European UnionFragile and conflict affected situationsGambia, TheGeorgiaHaitiHeavily indebted poor countries (HIPC)High incomeIBRD onlyIDA & IBRD totalIDA blendIDA onlyIDA totalIndiaIndonesiaIraqJordanKazakhstanKenyaKosovoKyrgyz RepublicLao PDRLatin America & Caribbean Latin America & Caribbean (excluding high income)Latin America & the Caribbean (IDA & IBRD countries)Least developed countries: UN classificationLebanonLesothoLiberiaLibyaLow & middle incomeLow incomeLower middle incomeMacedonia, FYRMadagascarMaliMexicoMiddle East & North AfricaMiddle East & North Africa (excluding high income)Middle East & North Africa (IDA & IBRD countries)Middle incomeMoldovaMongoliaMontenegroMozambiqueMyanmarNamibiaNepalNicaraguaOECD membersOther small statesPakistanParaguayPeruPhilippinesRwandaSerbiaSmall statesSouth AsiaSouth Asia (IDA & IBRD)South SudanSub-Saharan Africa Sub-Saharan Africa (excluding high income)Sub-Saharan Africa (IDA & IBRD countries)SudanSyrian Arab RepublicTajikistanTanzaniaThailandTunisiaTurkeyUgandaUkraineUpper middle incomeUzbekistanVietnamWest Bank and GazaWorldYemen, Rep.

Linea del tempo:

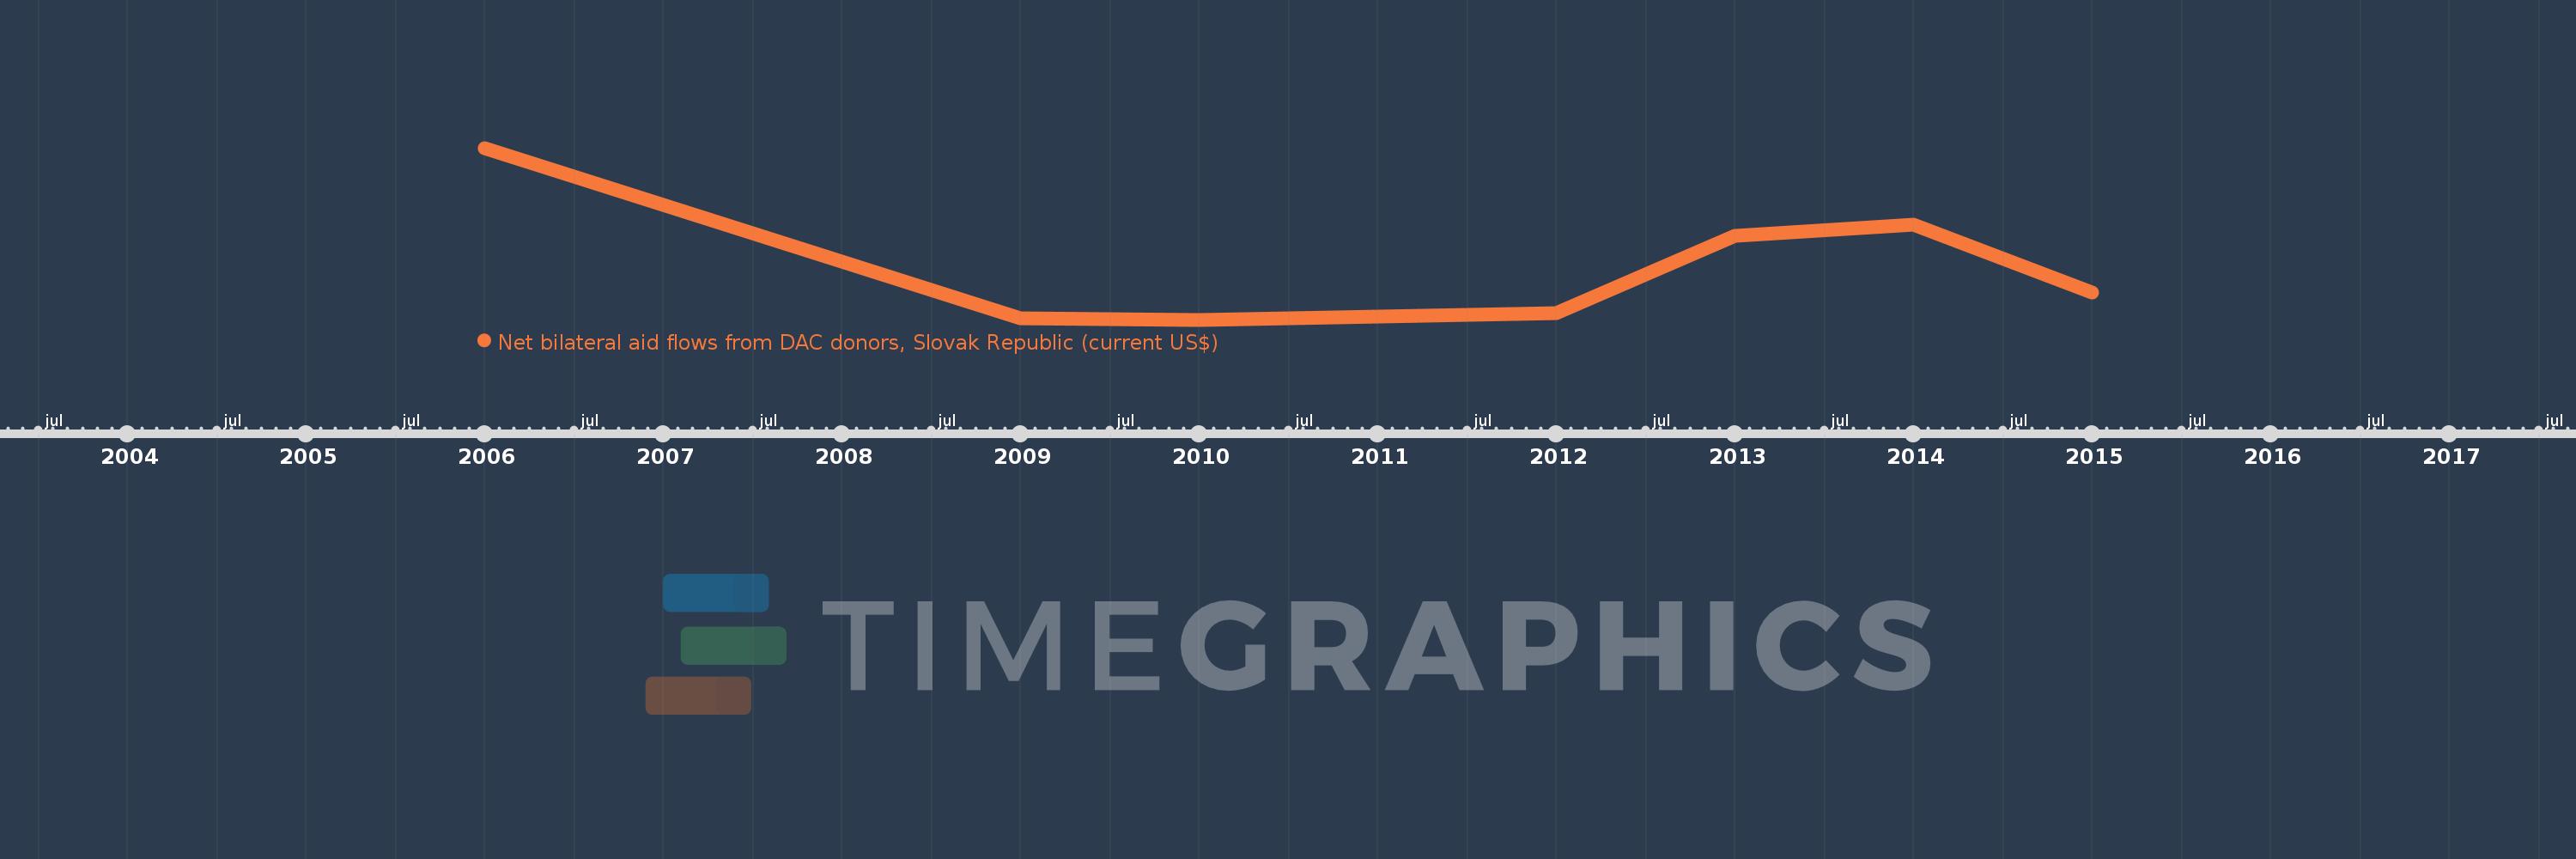
Questa scala temporale mostra un grafico dal 2006 anno al 2015 anno. Middle East & North Africa (IDA & IBRD countries). I dati fino ad 2005 anno non disponibili. Il numero di osservazioni attuali secondo i date: 7.

La fonte (nome):

Indicatori dello sviluppo mondiale

La fonte (organizzazione):

Development Assistance Committee of the Organisation for Economic Co-operation and Development, Geographical Distribution of Financial Flows to Developing Countries, Development Co-operation Report, and International Development Statistics database. Data are available online at: www.oecd.org/dac/stats/idsonline.

Categorie:

Aid Effectiveness

sono stati aggiornati

23 apr 2017 anni

Indicatori delle variazioni dei valori per anni

In media:
427.143 Mille.
Minima:
80.0 Mille.
1 gen 2010 anni
Massimo:
1.16 Mln
1 gen 2006 anni
Alla data di osservazione
Valore
Variazione assoluta
La variazione rispetto al valore precedente
1 gen 2006 anni
1.16 Mln
+1.16 Mln
0.0%
1 gen 2009 anni
90.0 Mille.
-1.07 Mln
-92.24%
1 gen 2010 anni
80.0 Mille.
-10.0 Mille.
-11.11%
1 gen 2012 anni
120.0 Mille.
+40.0 Mille.
50.0%
1 gen 2013 anni
610.0 Mille.
+490.0 Mille.
408.33%
1 gen 2014 anni
680.0 Mille.
+70.0 Mille.
11.48%
1 gen 2015 anni
250.0 Mille.
-430.0 Mille.
-63.24%

Classificazione dei paesi secondo i statistiche attuali per anni