33
/it/
AIzaSyB4mHJ5NPEv-XzF7P6NDYXjlkCWaeKw5bc
November 30, 2025
50234
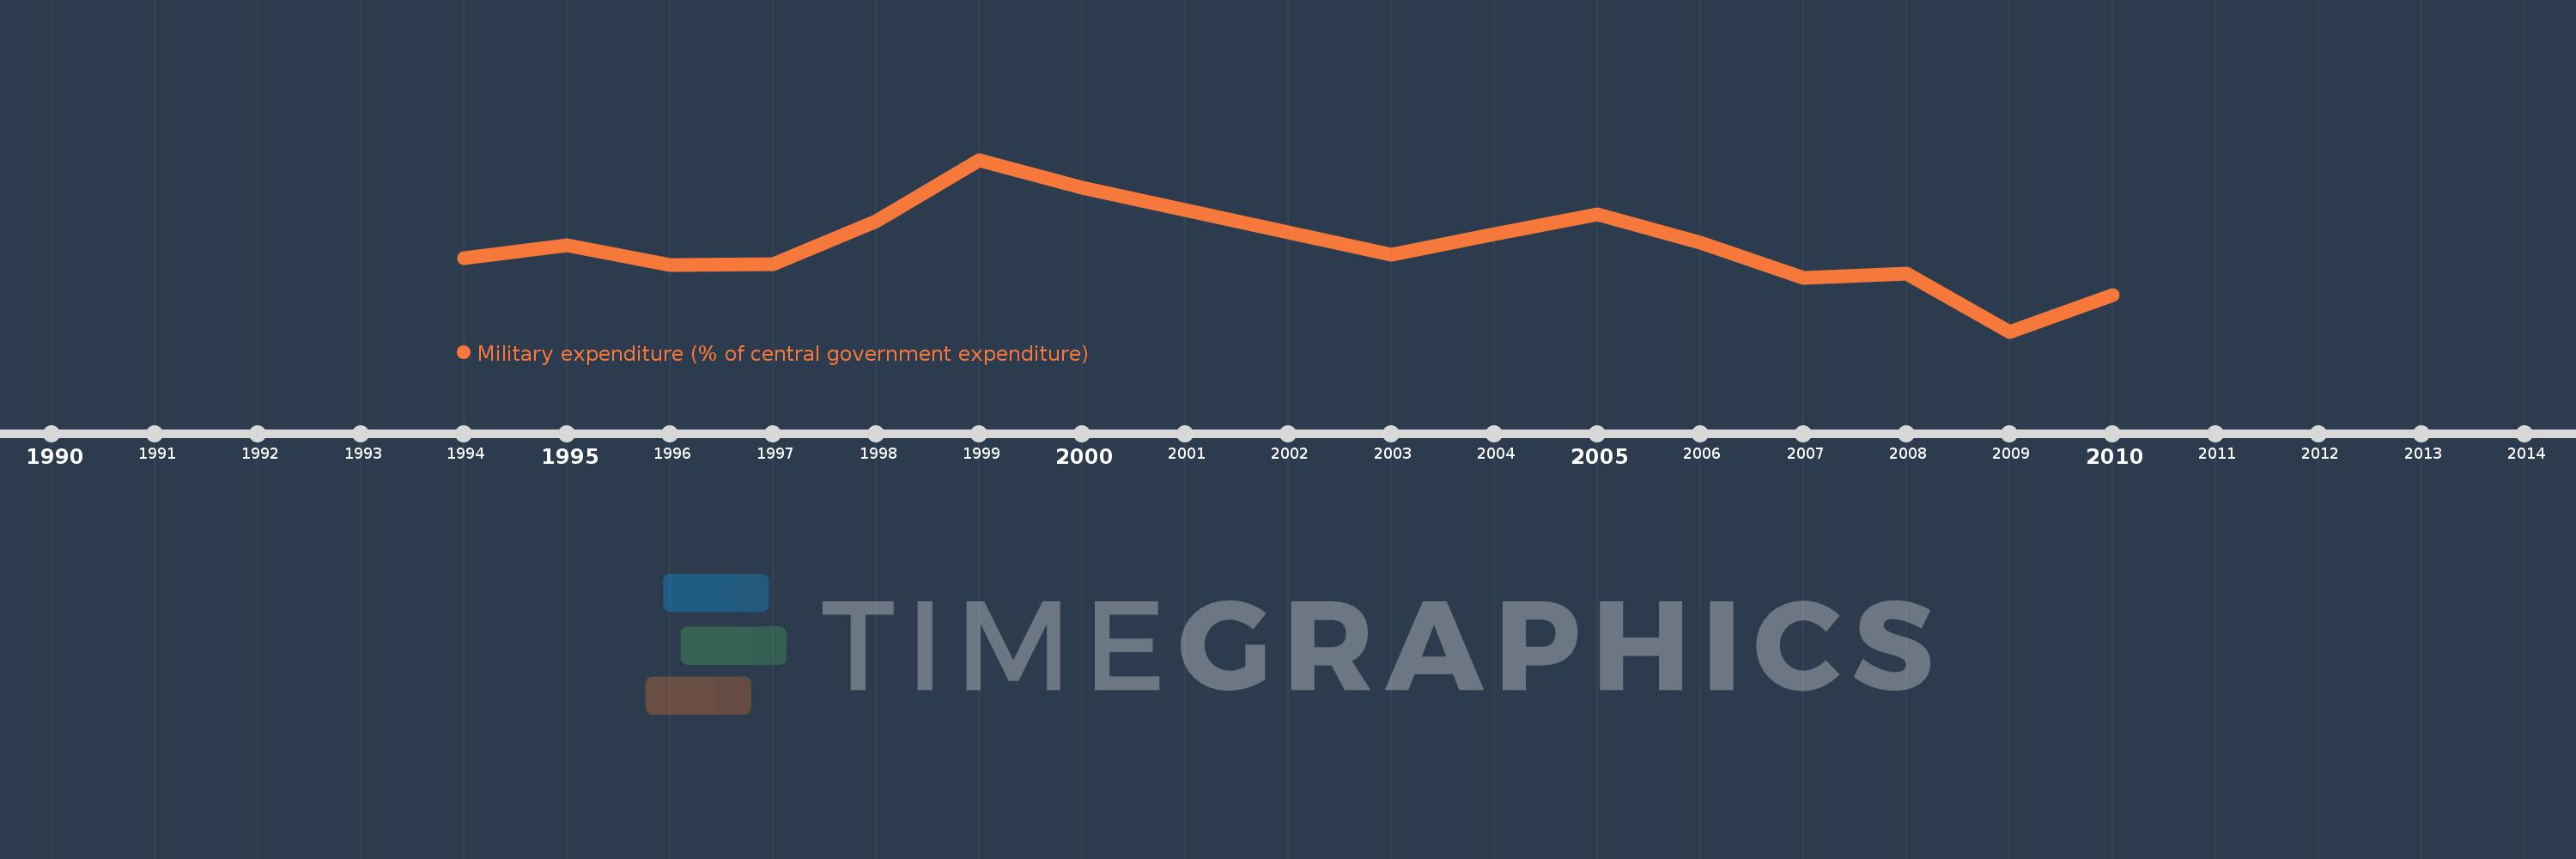
Middle East & North Africa (IDA & IBRD countries)
TMN
false
2
1
Military expenditure (% of central government expenditure)
2010,2009,2008,2007,2006,2005,2004,2003,2000,1999,1998,1997,1996,1995,1994