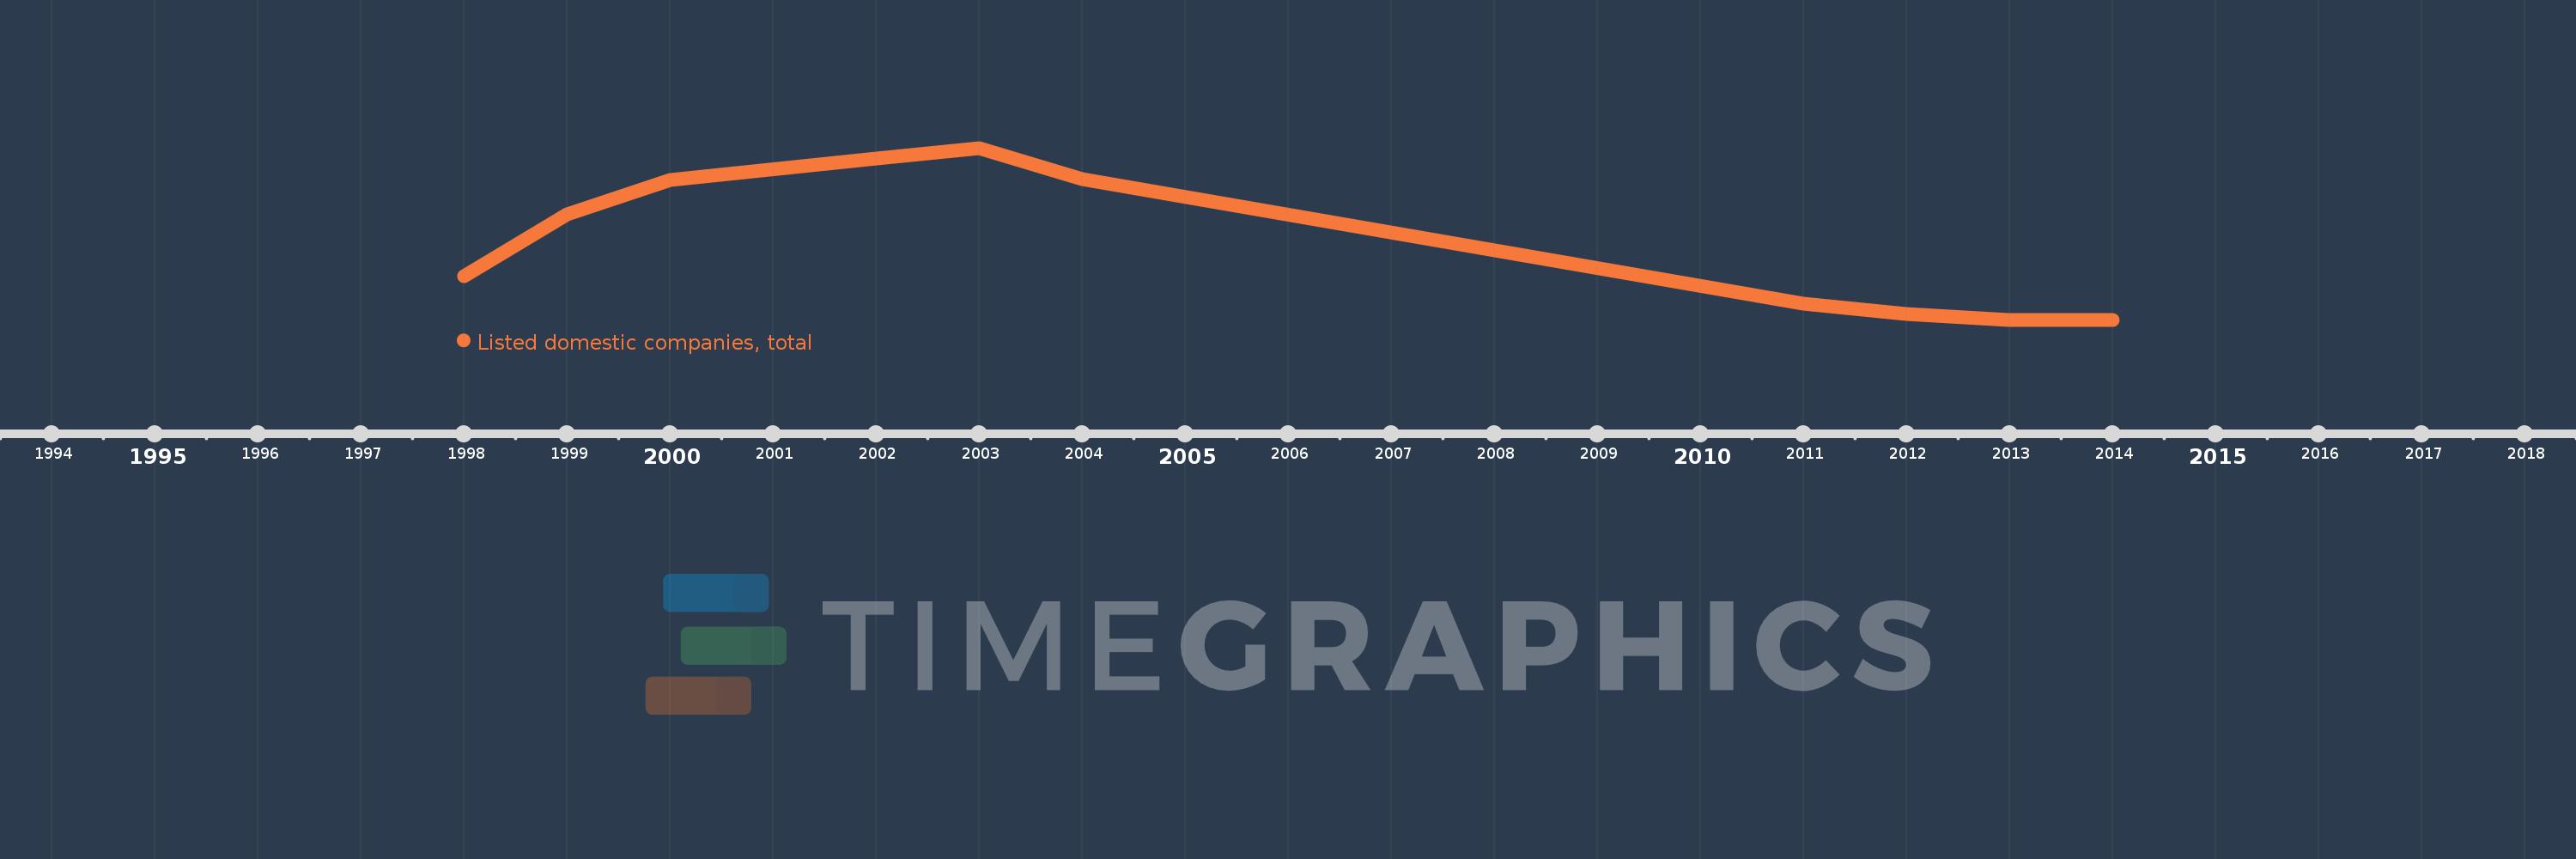
Questa scala temporale mostra un grafico dal 1998 anno al 2014 anno. Middle East & North Africa (IDA & IBRD countries). I dati fino ad 1997 anno non disponibili. Il numero di osservazioni attuali secondo i date: 10.
La fonte (nome):
Indicatori dello sviluppo mondiale
La fonte (organizzazione):
World Federation of Exchanges database.
Categorie:
Financial Sector
sono stati aggiornati
23 apr 2017 anni
Indicatori delle variazioni dei valori per anni
In media:
1.28 Mille.
Minima:
944.0
1 gen 2013 anni
Massimo:
1.681 Mille.
1 gen 2003 anni
Alla data di osservazione
Valore
Variazione assoluta
La variazione rispetto al valore precedente
1 gen 1998 anni
1.132 Mille.
+1.132 Mille.
0.0%
1 gen 1999 anni
1.396 Mille.
+264.0
23.32%
1 gen 2000 anni
1.544 Mille.
+148.0
10.6%
1 gen 2002 anni
1.635 Mille.
+91.0
5.89%
1 gen 2003 anni
1.681 Mille.
+46.0
2.81%
1 gen 2004 anni
1.546 Mille.
-135.0
-8.03%
1 gen 2011 anni
1.012 Mille.
-534.0
-34.54%
1 gen 2012 anni
968.0
-44.0
-4.35%
1 gen 2013 anni
944.0
-24.0
-2.48%
1 gen 2014 anni
944.0
0.0
0.0%
Classificazione dei paesi secondo i statistiche attuali per anni