33
/it/
AIzaSyB4mHJ5NPEv-XzF7P6NDYXjlkCWaeKw5bc
November 30, 2025
49765
Middle East & North Africa (IDA & IBRD countries)
TMN
false
2
1
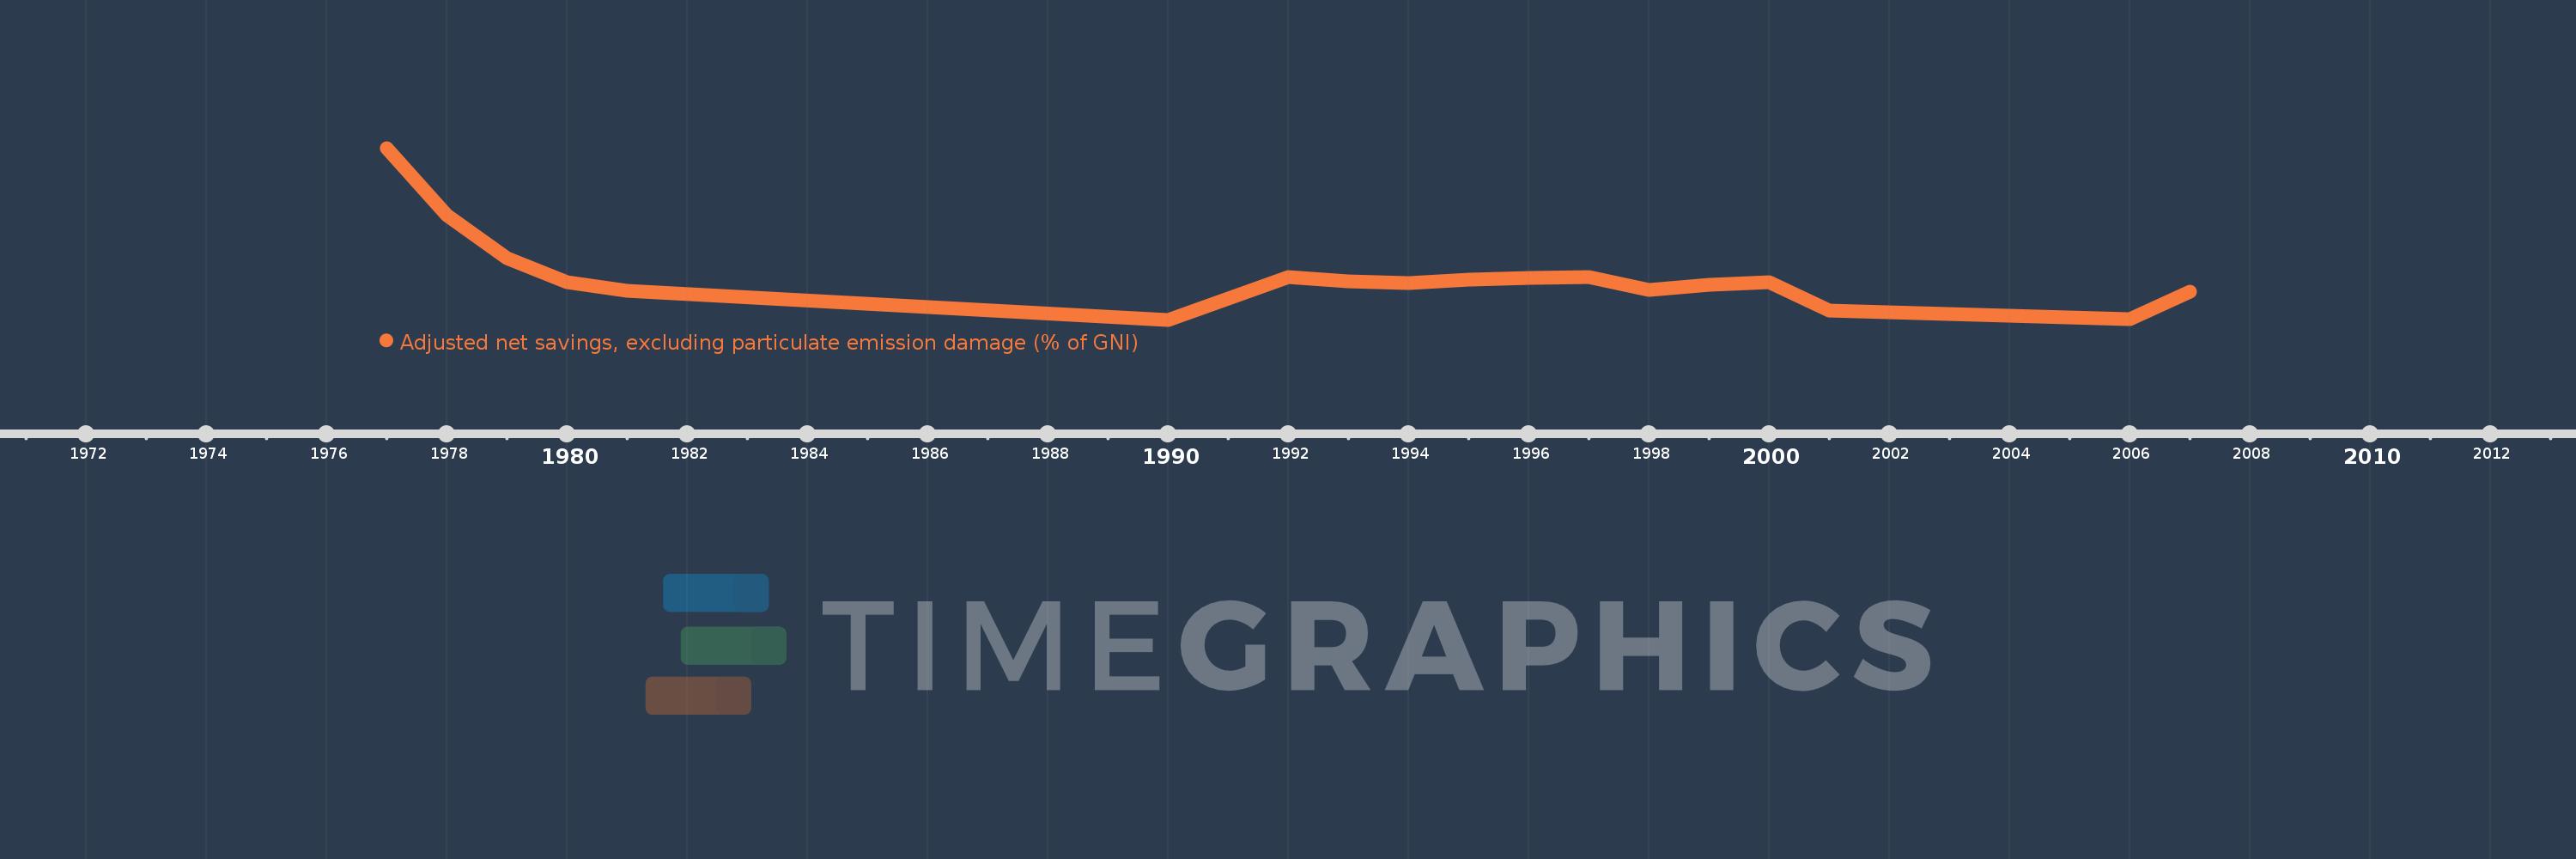
Adjusted net savings, excluding particulate emission damage (% of GNI)
2007,2006,2001,2000,1999,1998,1997,1996,1995,1994,1993,1992,1990,1981,1980,1979,1978,1977