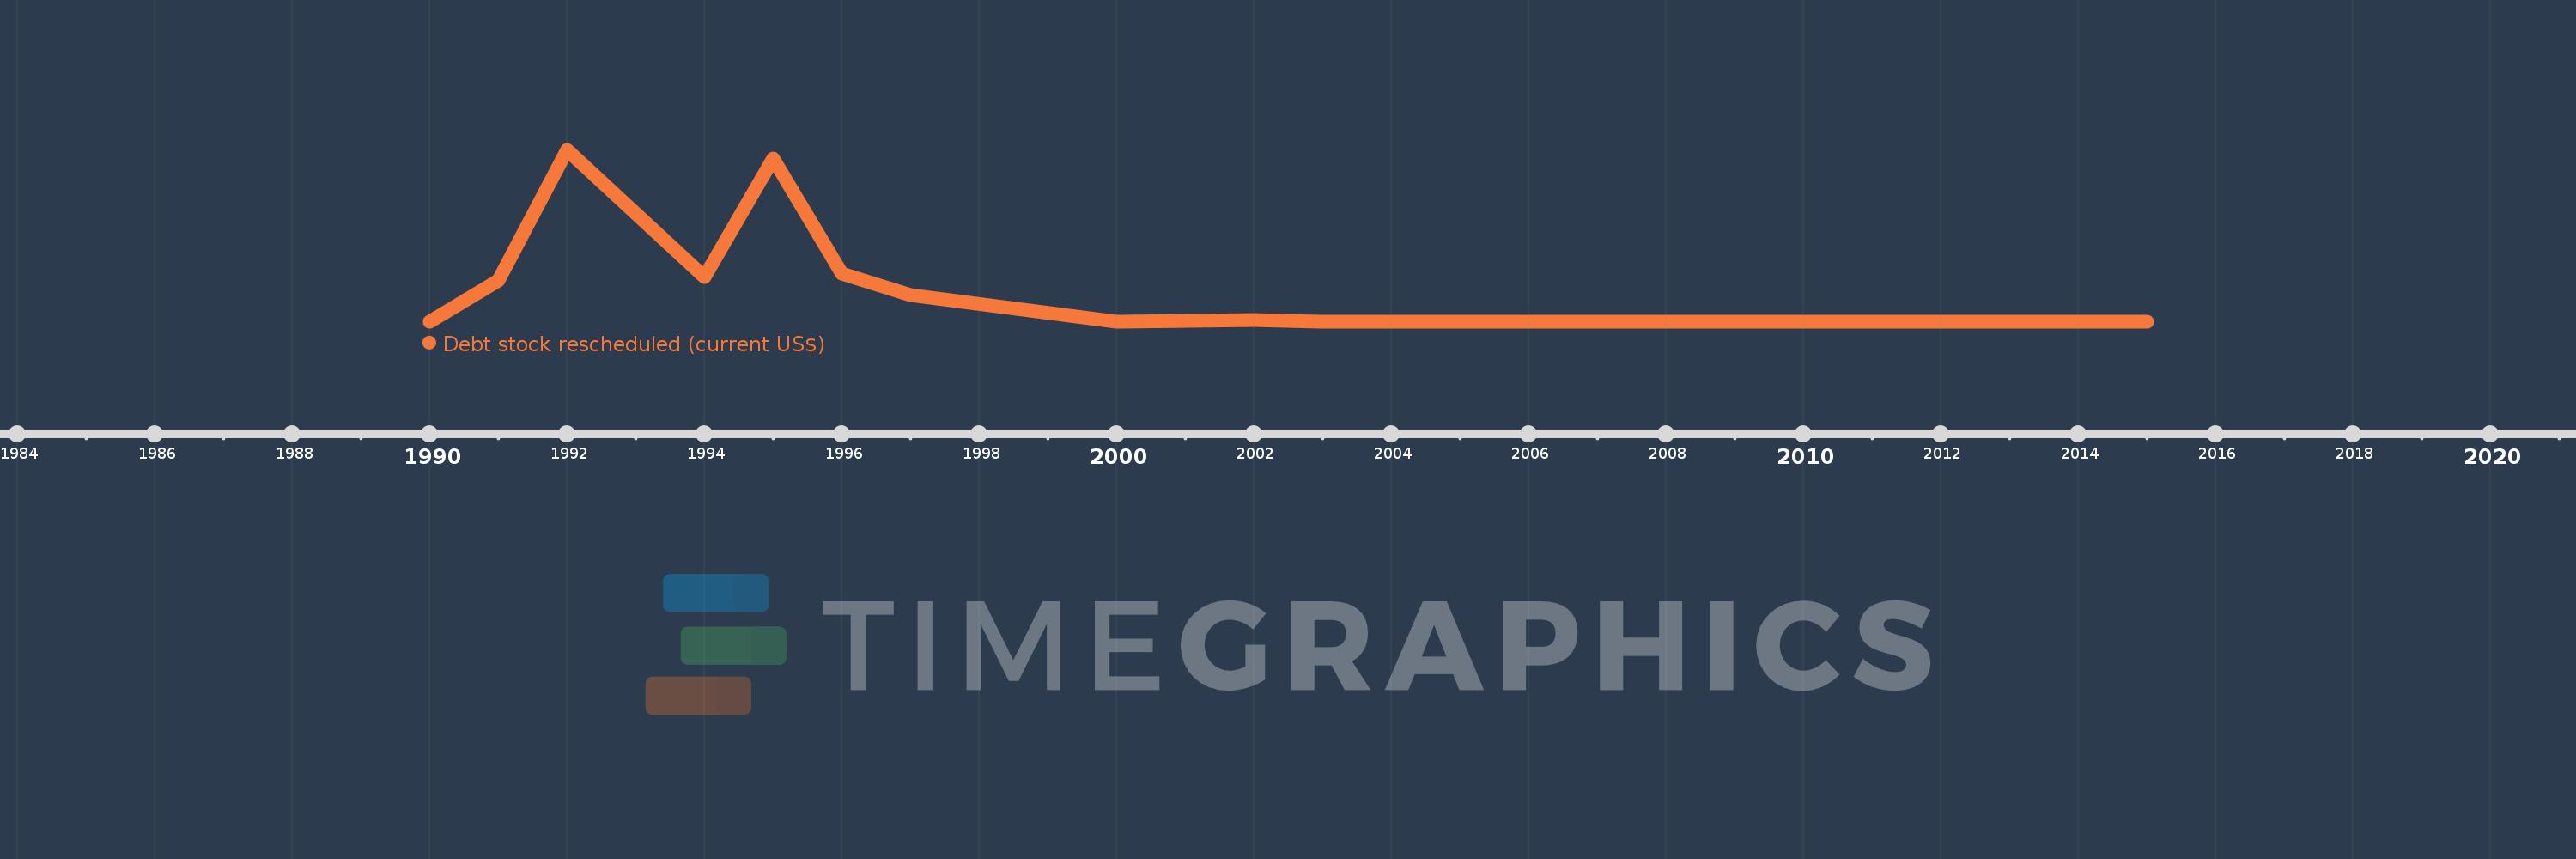
Questa scala temporale mostra un grafico dal 1990 anno al 2015 anno. Middle East & North Africa (excluding high income). I dati fino ad 1989 anno non disponibili. Il numero di osservazioni attuali secondo i date: 15.
La fonte (nome):
Indicatori dello sviluppo mondiale
La fonte (organizzazione):
World Bank, International Debt Statistics.
Categorie:
External Debt
sono stati aggiornati
23 apr 2017 anni
Indicatori delle variazioni dei valori per anni
In media:
2.201 Mlrd
Minima:
0.0
1 gen 2000 anni
Massimo:
11.355 Mlrd
1 gen 1992 anni
Alla data di osservazione
Valore
Variazione assoluta
La variazione rispetto al valore precedente
1 gen 1990 anni
19.206 Mln
+19.206 Mln
0.0%
1 gen 1991 anni
2.732 Mlrd
+2.713 Mlrd
14.13 Mille.%
1 gen 1992 anni
11.355 Mlrd
+8.623 Mlrd
315.63%
1 gen 1994 anni
2.978 Mlrd
-8.377 Mlrd
-73.77%
1 gen 1995 anni
10.785 Mlrd
+7.807 Mlrd
262.1%
1 gen 1996 anni
3.178 Mlrd
-7.607 Mlrd
-70.53%
1 gen 1997 anni
1.805 Mlrd
-1.373 Mlrd
-43.2%
1 gen 2000 anni
0.0
-1.805 Mlrd
-100.0%
1 gen 2002 anni
142.438 Mln
+142.438 Mln
%
1 gen 2003 anni
0.0
-142.438 Mln
-100.0%
1 gen 2004 anni
0.0
0.0
%
1 gen 2005 anni
16.45 Mln
+16.45 Mln
%
1 gen 2008 anni
0.0
-16.45 Mln
-100.0%
1 gen 2011 anni
1.757 Mln
+1.757 Mln
%
1 gen 2015 anni
0.0
-1.757 Mln
-100.0%
Classificazione dei paesi secondo i statistiche attuali per anni