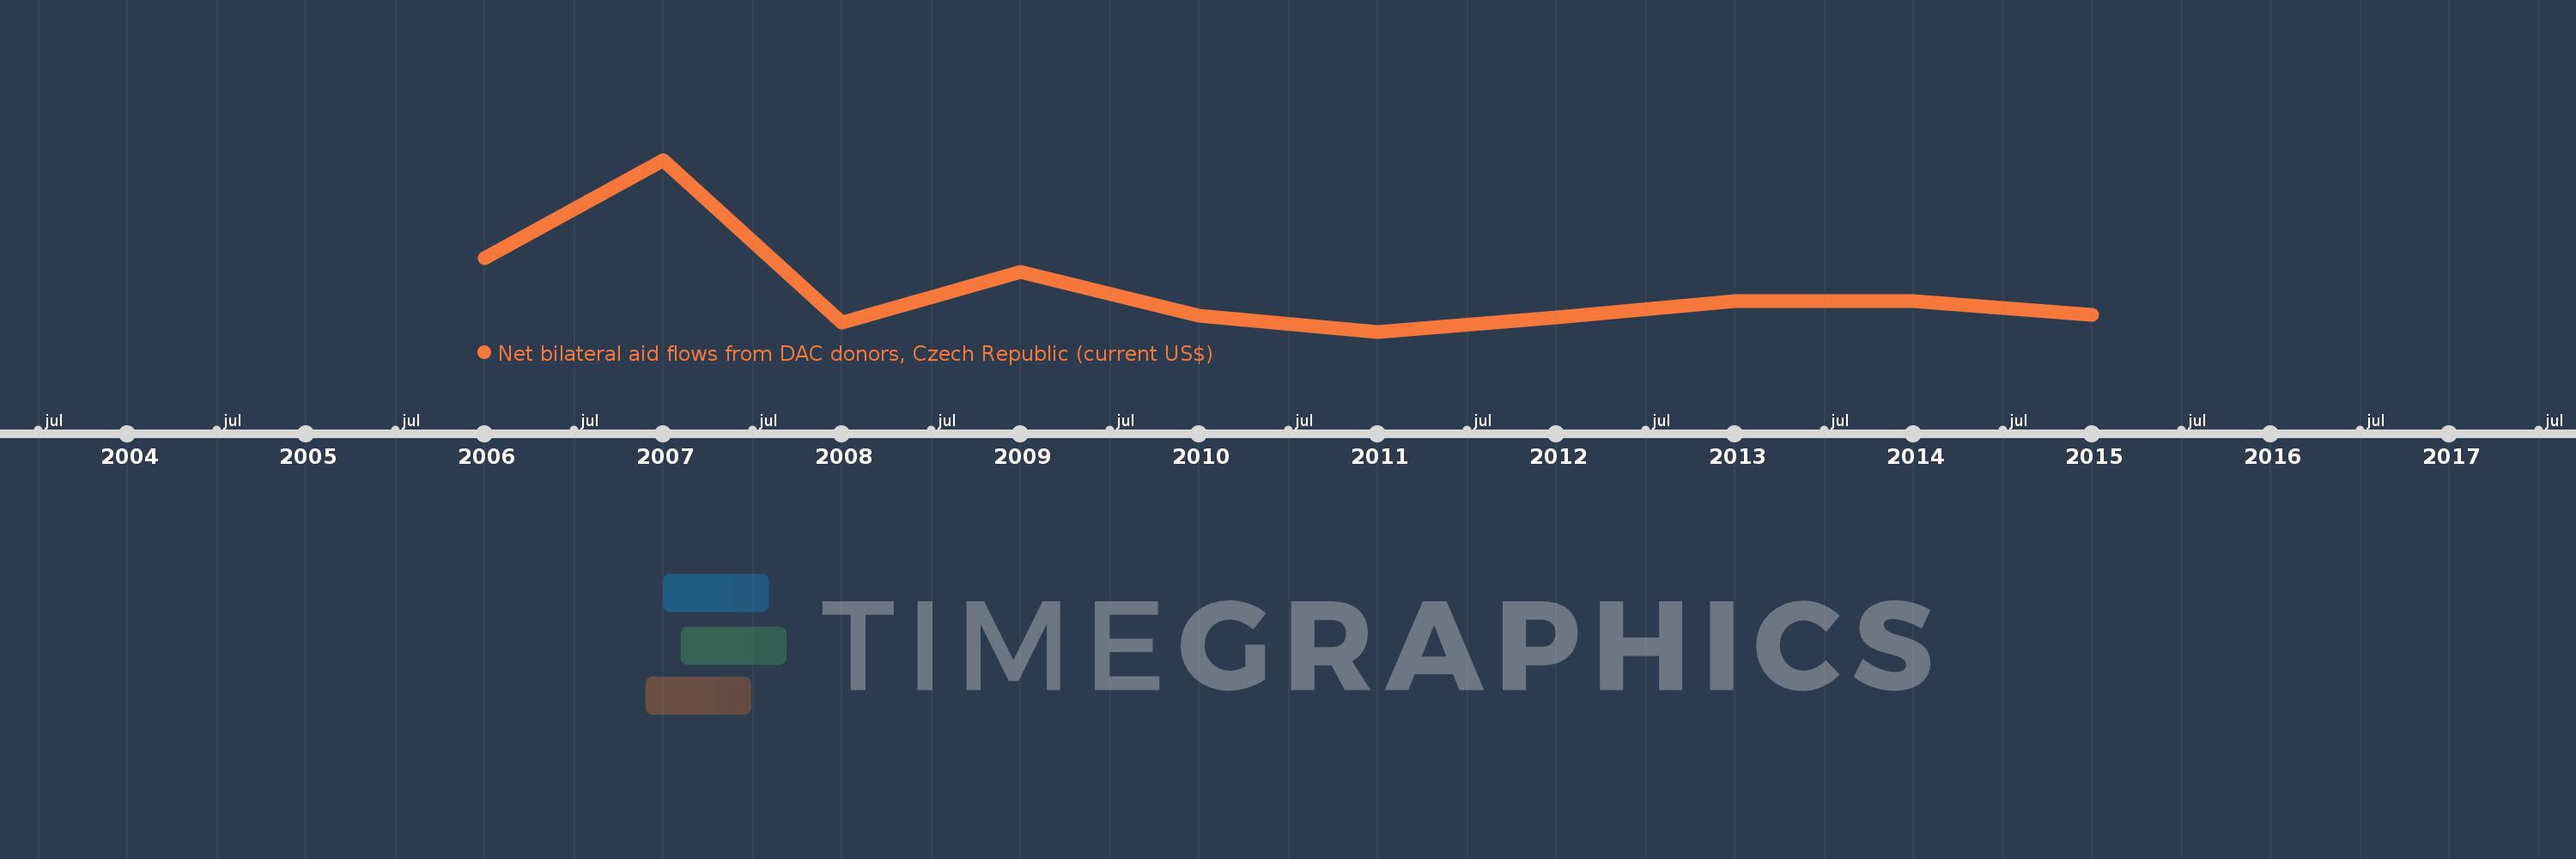
Questa scala temporale mostra un grafico dal 2006 anno al 2015 anno. Middle East & North Africa. I dati fino ad 2005 anno non disponibili. Il numero di osservazioni attuali secondo i date: 10.
La fonte (nome):
Indicatori dello sviluppo mondiale
La fonte (organizzazione):
Development Assistance Committee of the Organisation for Economic Co-operation and Development, Geographical Distribution of Financial Flows to Developing Countries, Development Co-operation
Categorie:
Aid Effectiveness
sono stati aggiornati
23 apr 2017 anni
Indicatori delle variazioni dei valori per anni
In media:
7.024 Mln
Minima:
3.5 Mln
1 gen 2011 anni
Massimo:
17.84 Mln
1 gen 2007 anni
Alla data di osservazione
Valore
Variazione assoluta
La variazione rispetto al valore precedente
1 gen 2006 anni
9.61 Mln
+9.61 Mln
0.0%
1 gen 2007 anni
17.84 Mln
+8.23 Mln
85.64%
1 gen 2008 anni
4.24 Mln
-13.6 Mln
-76.23%
1 gen 2009 anni
8.5 Mln
+4.26 Mln
100.47%
1 gen 2010 anni
4.85 Mln
-3.65 Mln
-42.94%
1 gen 2011 anni
3.5 Mln
-1.35 Mln
-27.84%
1 gen 2012 anni
4.71 Mln
+1.21 Mln
34.57%
1 gen 2013 anni
6.04 Mln
+1.33 Mln
28.24%
1 gen 2014 anni
6.03 Mln
-10.0 Mille.
-0.17%
1 gen 2015 anni
4.92 Mln
-1.11 Mln
-18.41%
Classificazione dei paesi secondo i statistiche attuali per anni