29
/it/
it
AIzaSyAYiBZKx7MnpbEhh9jyipgxe19OcubqV5w
April 1, 2024
46377
Low income
LIC
false
2
1
Net bilateral aid flows from DAC donors, Slovenia (current US$)
2015,2014,2013,2012,2011,2010,2009,2008,2007,2006,2005,2004
Download
Biblioteca di statistiche globali →Low income →

Net bilateral aid flows from DAC donors, Slovenia (current US$)

Queste statistiche in altri paesi:
AfghanistanAlbaniaAlgeriaArab WorldArgentinaBelarusBosnia and HerzegovinaBrazilBurkina FasoBurundiCabo VerdeCameroonCaribbean small statesCentral African RepublicCentral Europe and the BalticsChadChinaColombiaCongo, Dem. Rep.Congo, Rep.Costa RicaCroatiaCubaDominicaEast Asia & PacificEast Asia & Pacific (excluding high income)East Asia & Pacific (IDA & IBRD countries)Egypt, Arab Rep.EritreaEthiopiaEurope & Central AsiaEurope & Central Asia (excluding high income)Europe & Central Asia (IDA & IBRD countries)European UnionFragile and conflict affected situationsGeorgiaGhanaGuineaGuyanaHaitiHeavily indebted poor countries (HIPC)High incomeIBRD onlyIDA & IBRD totalIDA blendIDA onlyIDA totalIndiaIran, Islamic Rep.IraqJamaicaJordanKenyaKosovoKyrgyz RepublicLatin America & Caribbean Latin America & Caribbean (excluding high income)Latin America & the Caribbean (IDA & IBRD countries)Least developed countries: UN classificationLiberiaLibyaLow & middle incomeLow incomeLower middle incomeMacedonia, FYRMadagascarMalawiMalaysiaMaliMarshall IslandsMexicoMicronesia, Fed. Sts.Middle East & North AfricaMiddle East & North Africa (excluding high income)Middle East & North Africa (IDA & IBRD countries)Middle incomeMoldovaMontenegroMyanmarNepalNigerNigeriaOECD membersOther small statesPacific island small statesPakistanPalauPhilippinesRwandaSenegalSerbiaSeychellesSierra LeoneSmall statesSomaliaSouth AfricaSouth AsiaSouth Asia (IDA & IBRD)South SudanSri LankaSt. LuciaSt. Vincent and the GrenadinesSub-Saharan Africa Sub-Saharan Africa (excluding high income)Sub-Saharan Africa (IDA & IBRD countries)SudanSyrian Arab RepublicTajikistanTunisiaTurkeyUgandaUkraineUpper middle incomeUzbekistanVenezuela, RBWest Bank and GazaWorldZimbabwe
Linea del tempo:
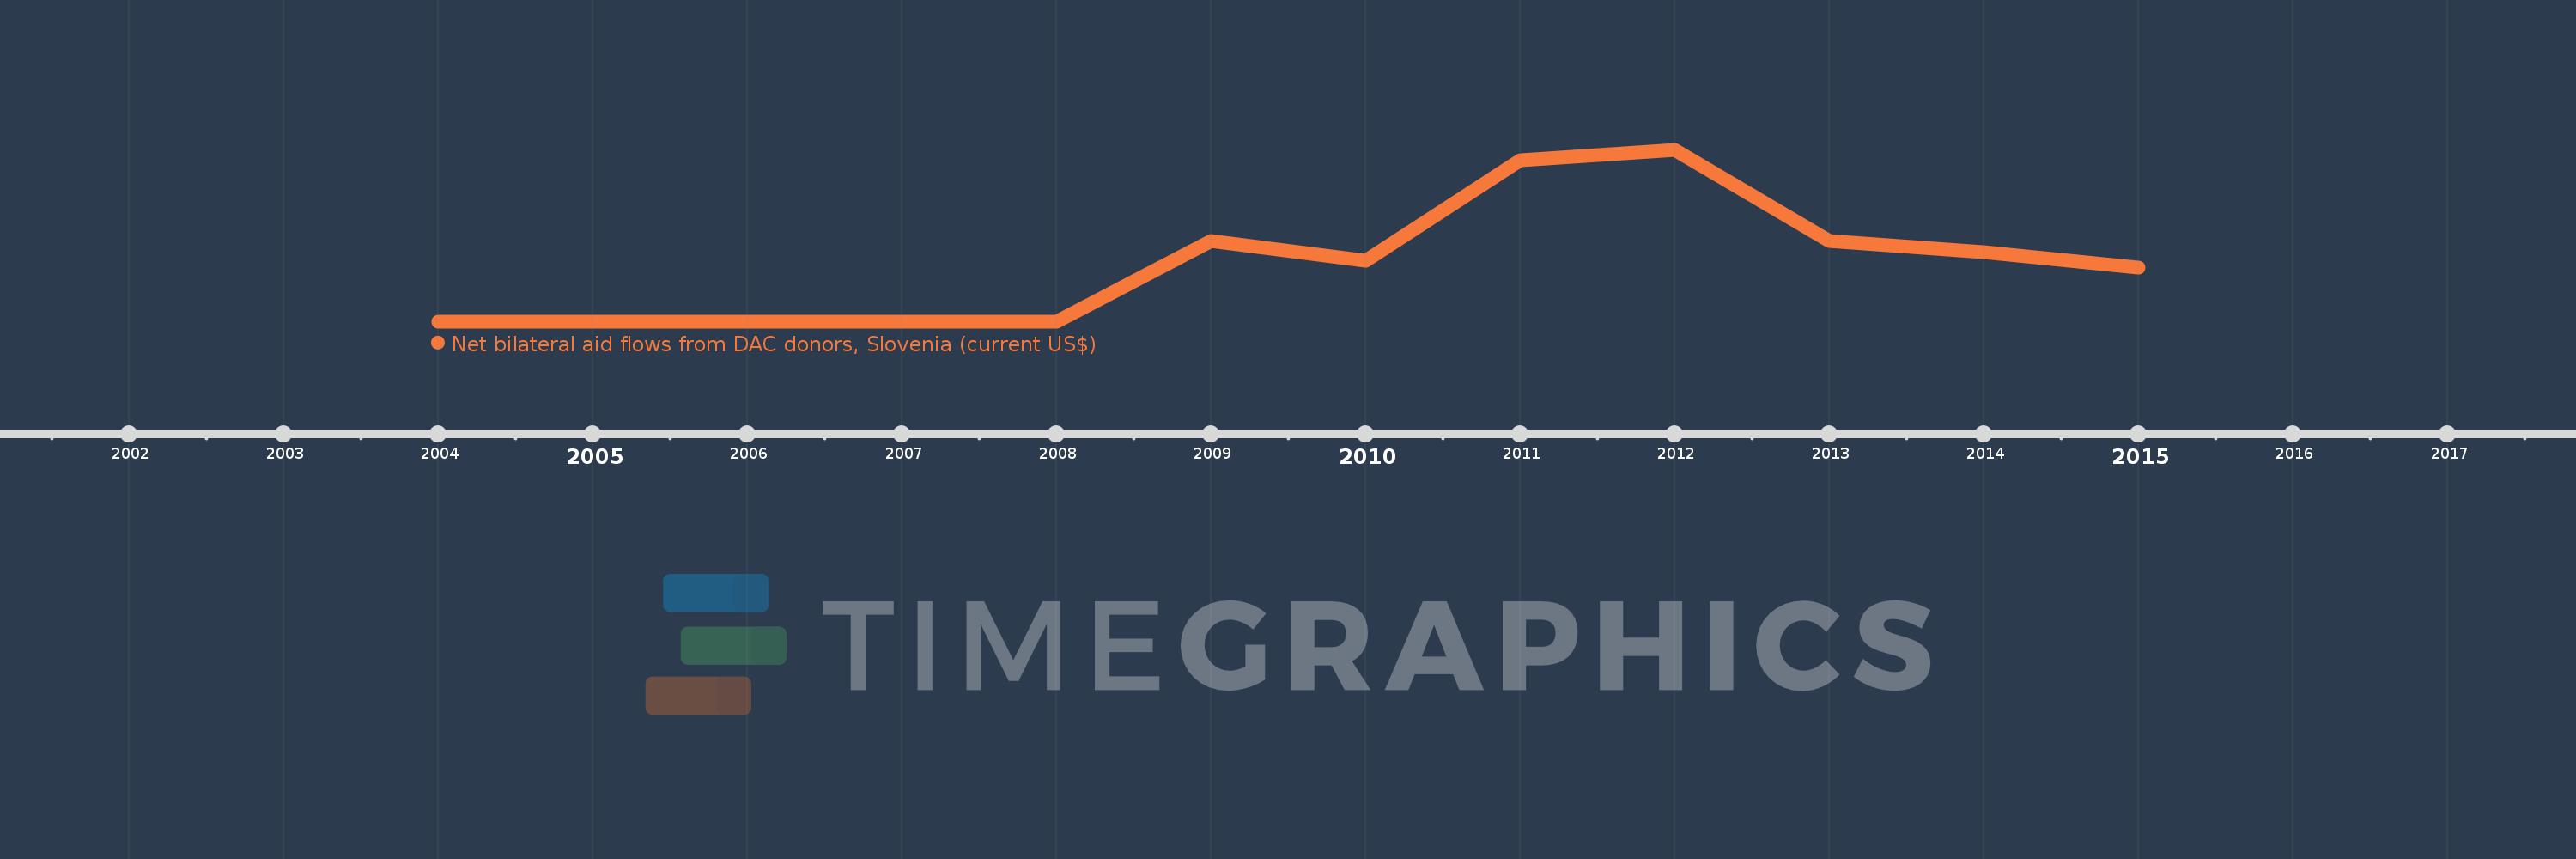
Questa scala temporale mostra un grafico dal 2004 anno al 2015 anno. Low income. I dati fino ad 2003 anno non disponibili. Il numero di osservazioni attuali secondo i date: 12.
La fonte (nome):
Indicatori dello sviluppo mondiale
La fonte (organizzazione):
Development Assistance Committee of the Organisation for Economic Co-operation and Development, Geographical Distribution of Financial Flows to Developing Countries, Development Co-operation Report, and International Development Statistics database. Data are available online at: www.oecd.org/dac/stats/idsonline.
Categorie:
Aid Effectiveness
sono stati aggiornati
23 apr 2017 anni
Indicatori delle variazioni dei valori per anni
In media:
462.5 Mille.
Minima:
0.0
1 gen 2004 anni
Massimo:
1.4 Mln
1 gen 2012 anni
Alla data di osservazione
Valore
Variazione assoluta
La variazione rispetto al valore precedente
1 gen 2004 anni
0.0
0.0
0.0%
1 gen 2005 anni
0.0
0.0
%
1 gen 2006 anni
0.0
0.0
%
1 gen 2007 anni
0.0
0.0
%
1 gen 2008 anni
0.0
0.0
%
1 gen 2009 anni
660.0 Mille.
+660.0 Mille.
%
1 gen 2010 anni
500.0 Mille.
-160.0 Mille.
-24.24%
1 gen 2011 anni
1.32 Mln
+820.0 Mille.
164.0%
1 gen 2012 anni
1.4 Mln
+80.0 Mille.
6.06%
1 gen 2013 anni
660.0 Mille.
-740.0 Mille.
-52.86%
1 gen 2014 anni
570.0 Mille.
-90.0 Mille.
-13.64%
1 gen 2015 anni
440.0 Mille.
-130.0 Mille.
-22.81%
Classificazione dei paesi secondo i statistiche attuali per anni

Commenti:

Inviare
PremiumAbout & FeedbackAccordoPrivatezza
logo
© 2022 Selected Technologies LLC – Morgan Hill, California