Download Queste statistiche in altri paesi:
Linea del tempo:
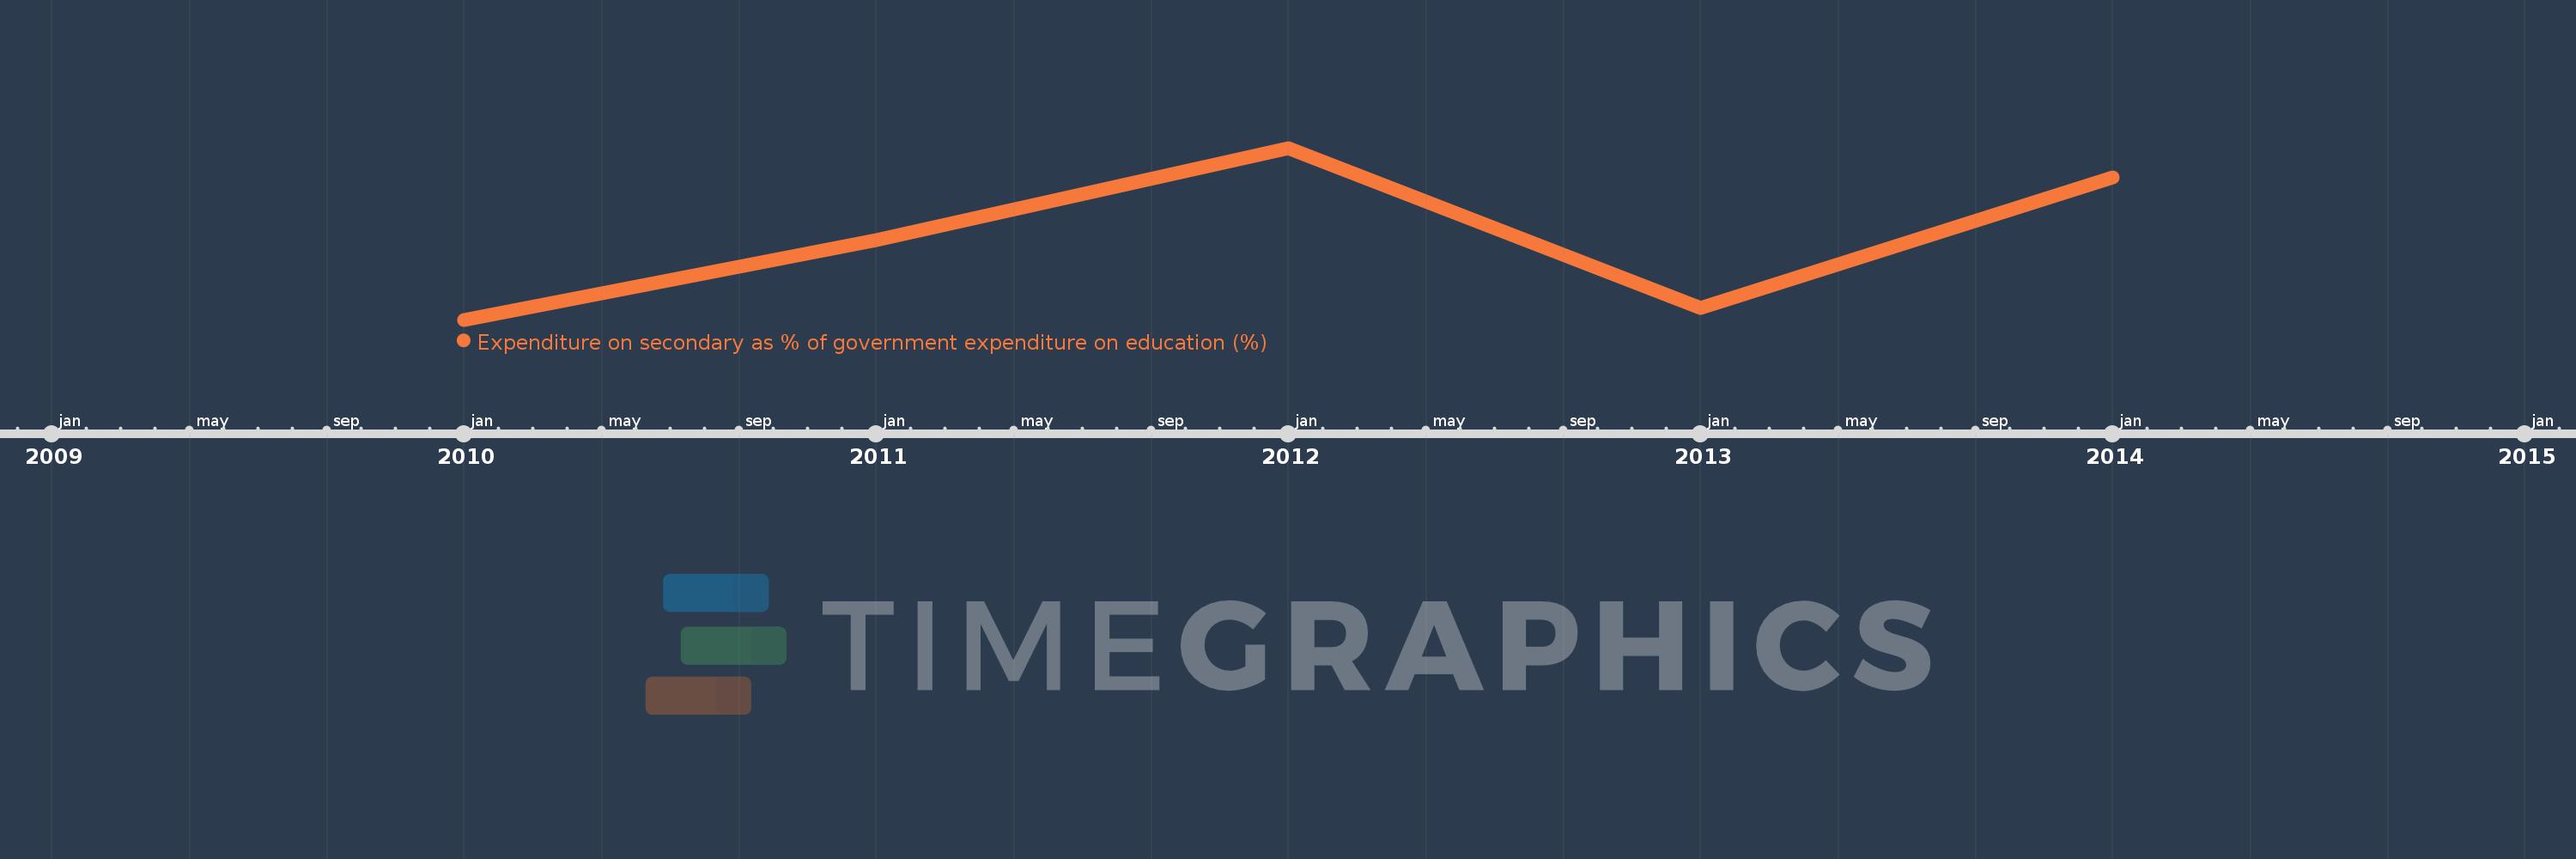
Questa scala temporale mostra un grafico dal 2010 anno al 2014 anno. Low income. I dati fino ad 2009 anno non disponibili. Il numero di osservazioni attuali secondo i date: 5.
La fonte (nome):
Indicatori dello sviluppo mondiale
La fonte (organizzazione):
UNESCO Institute for Statistics
Categorie:
Education
sono stati aggiornati
23 apr 2017 anni
Indicatori delle variazioni dei valori per anni
Minima:
24.611
1 gen 2010 anni
Massimo:
26.725
1 gen 2012 anni
Alla data di osservazione
Valore
Variazione assoluta
La variazione rispetto al valore precedente
1 gen 2010 anni
24.611
+24.611
0.0%
1 gen 2011 anni
25.592
+0.981
3.99%
1 gen 2012 anni
26.725
+1.133
4.43%
1 gen 2013 anni
24.759
-1.966
-7.36%
1 gen 2014 anni
26.364
+1.604
6.48%
Classificazione dei paesi secondo i statistiche attuali per anni