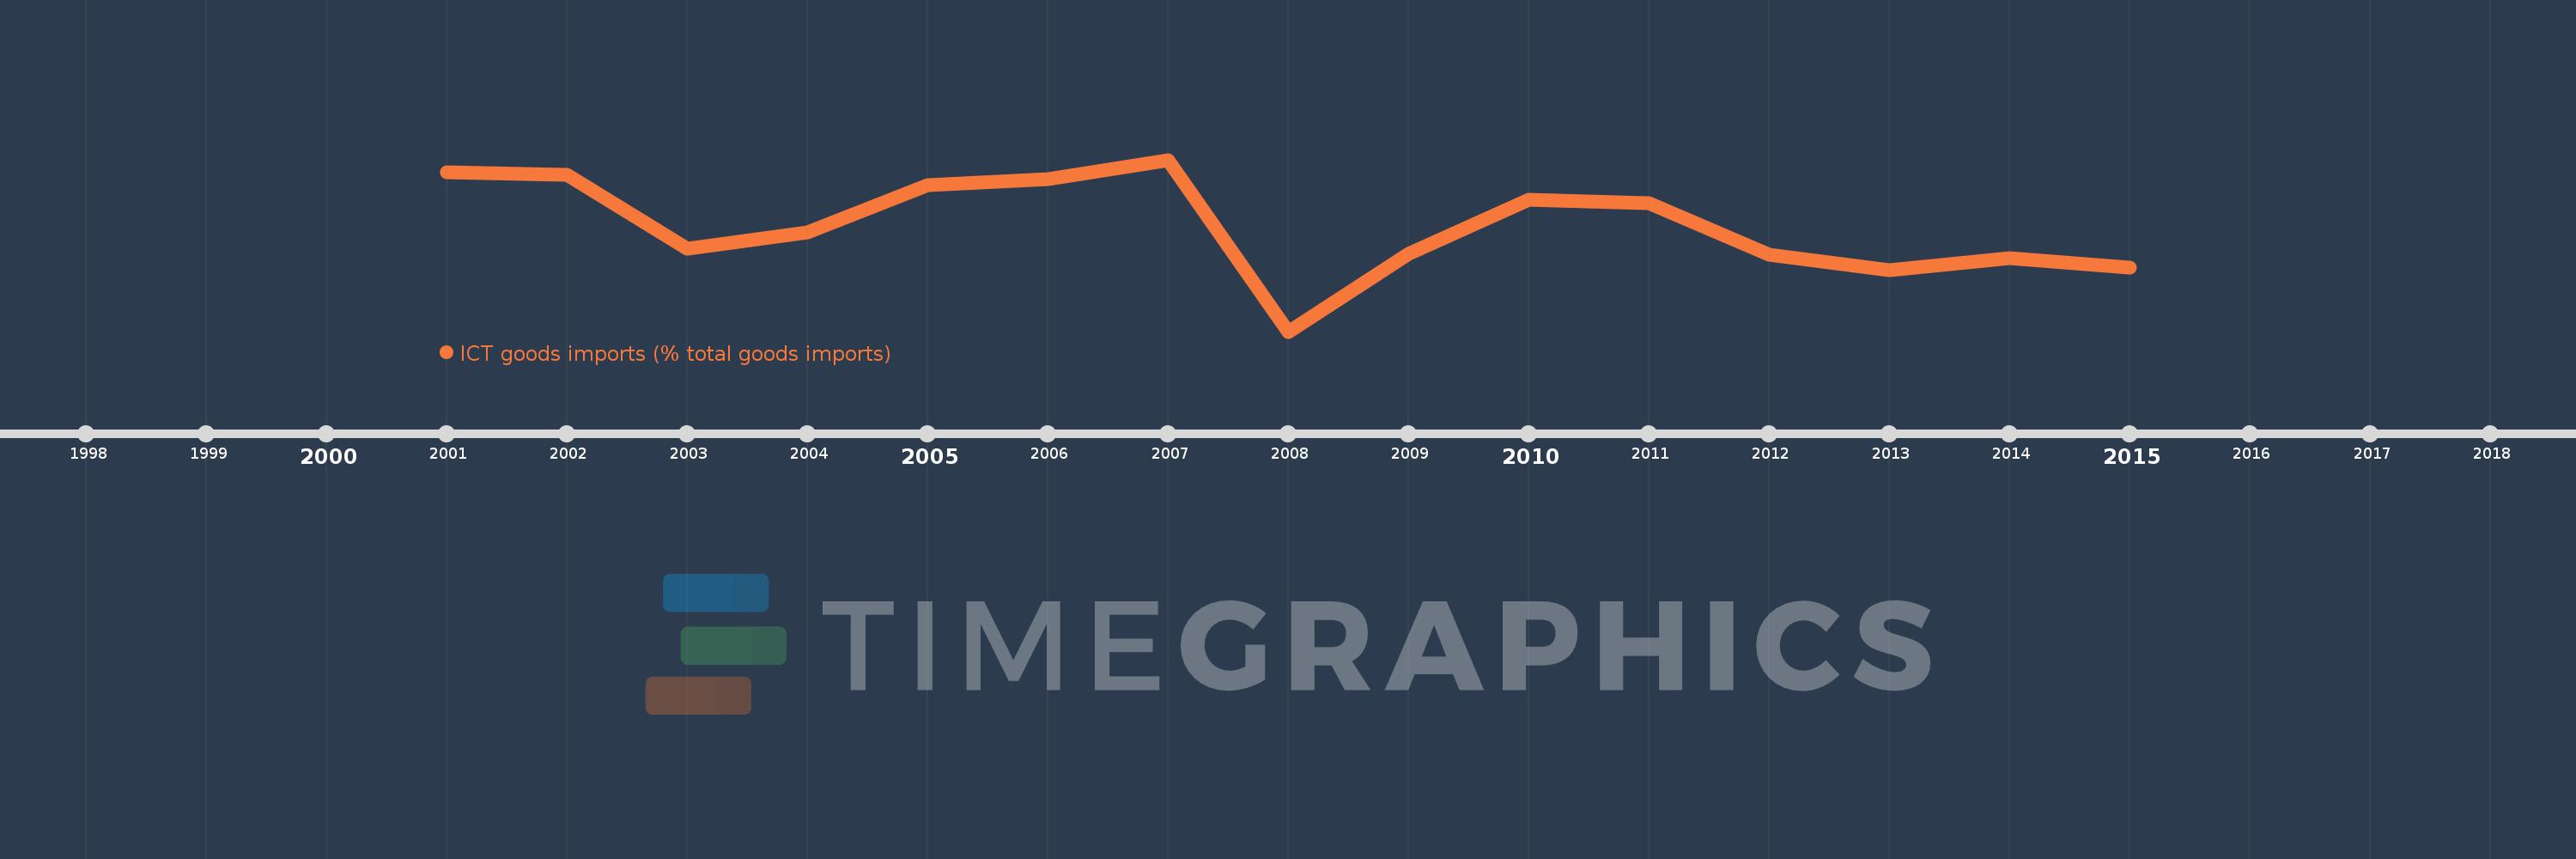
Questa scala temporale mostra un grafico dal 2001 anno al 2015 anno. Latin America & the Caribbean (IDA & IBRD countries). I dati fino ad 2000 anno non disponibili. Il numero di osservazioni attuali secondo i date: 15.
La fonte (nome):
Indicatori dello sviluppo mondiale
La fonte (organizzazione):
United Nations Conference on Trade and Development's UNCTADstat database at http://unctadstat.unctad.org/ReportFolders/reportFolders.aspx.
Categorie:
Infrastructure, Private Sector, Trade
sono stati aggiornati
23 apr 2017 anni
Indicatori delle variazioni dei valori per anni
In media:
11.999
Minima:
9.734
1 gen 2008 anni
Massimo:
13.424
1 gen 2007 anni
Alla data di osservazione
Valore
Variazione assoluta
La variazione rispetto al valore precedente
1 gen 2001 anni
13.158
+13.158
0.0%
1 gen 2002 anni
13.1
-0.058
-0.44%
1 gen 2003 anni
11.513
-1.587
-12.12%
1 gen 2004 anni
11.869
+0.356
3.09%
1 gen 2005 anni
12.874
+1.005
8.47%
1 gen 2006 anni
13.001
+0.126
0.98%
1 gen 2007 anni
13.424
+0.423
3.26%
1 gen 2008 anni
9.734
-3.69
-27.49%
1 gen 2009 anni
11.396
+1.662
17.07%
1 gen 2010 anni
12.56
+1.164
10.22%
1 gen 2011 anni
12.498
-0.062
-0.5%
1 gen 2012 anni
11.377
-1.121
-8.97%
1 gen 2013 anni
11.056
-0.321
-2.82%
1 gen 2014 anni
11.316
+0.26
2.35%
1 gen 2015 anni
11.105
-0.212
-1.87%
Classificazione dei paesi secondo i statistiche attuali per anni