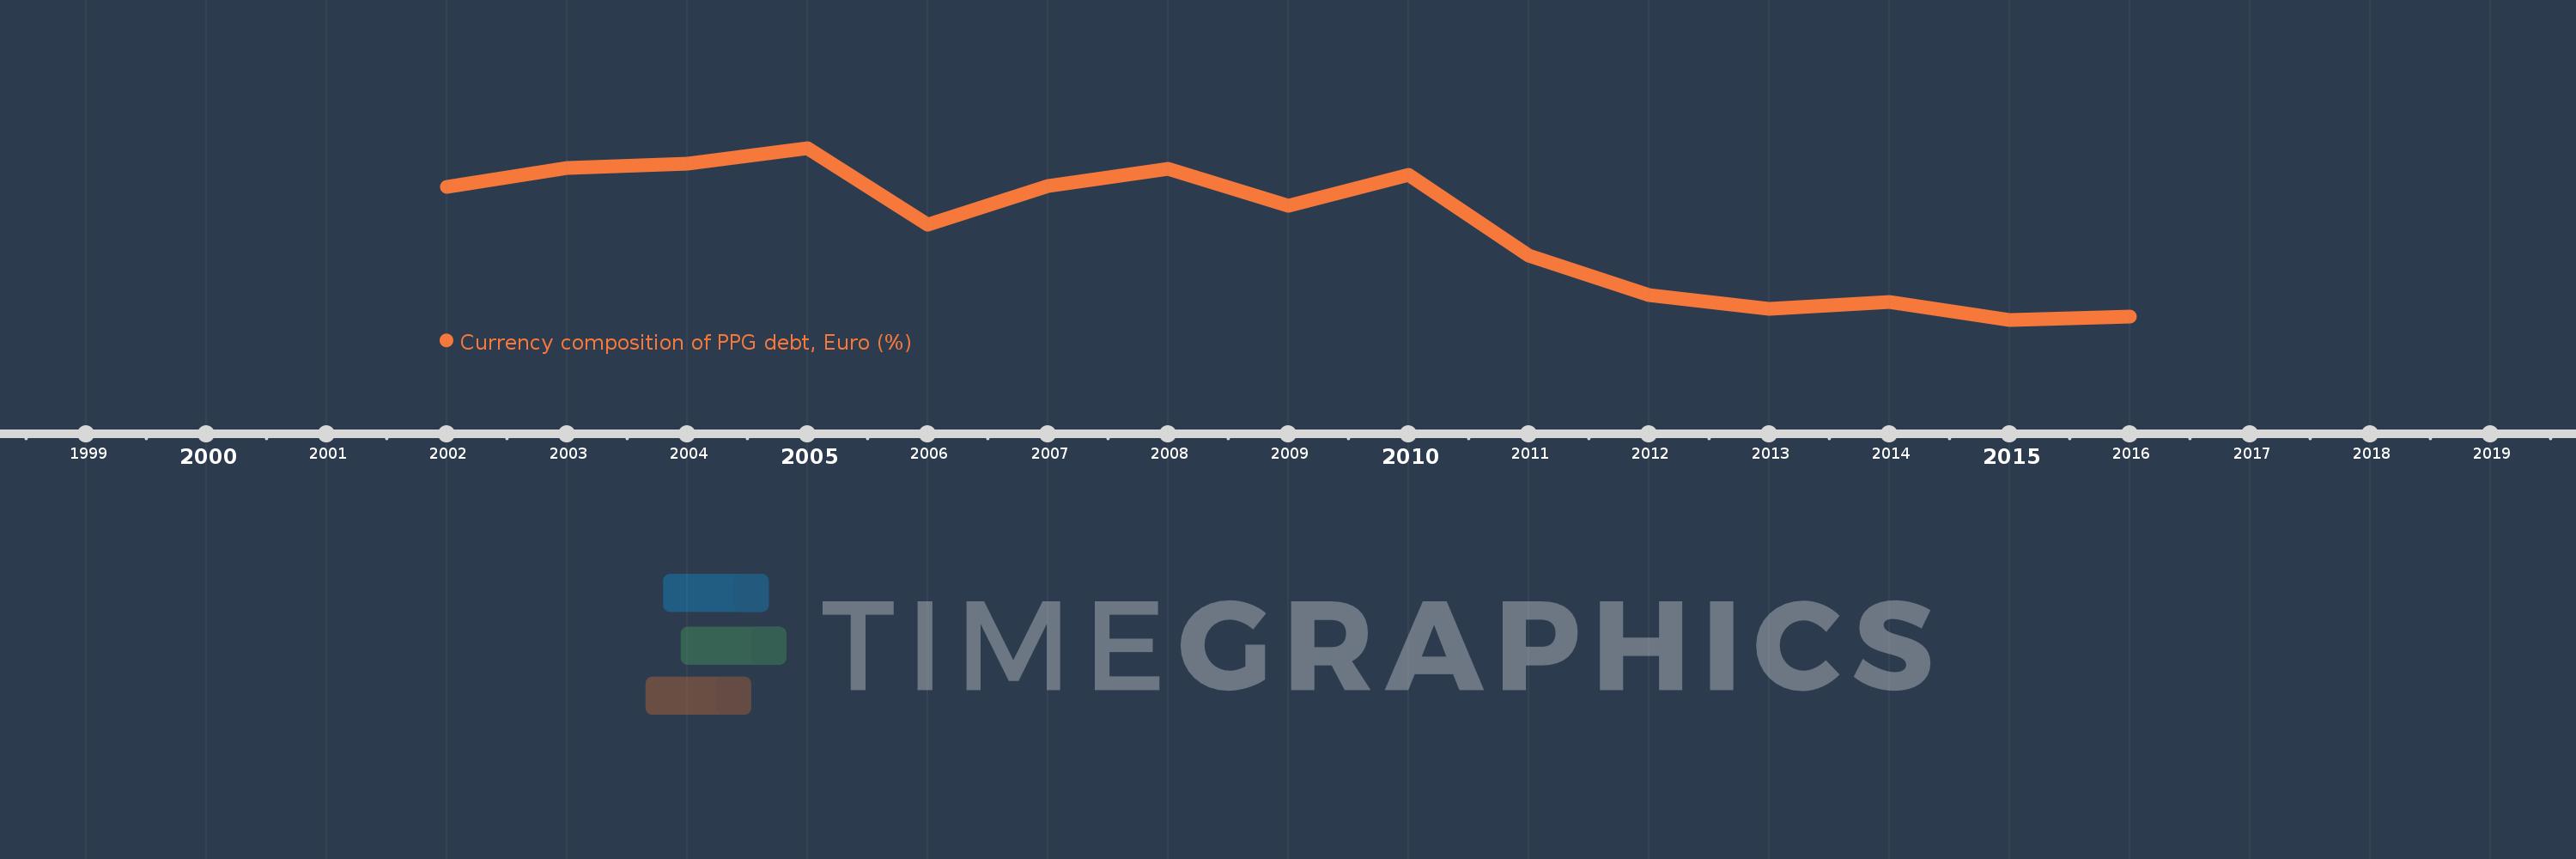
Questa scala temporale mostra un grafico dal 2002 anno al 2016 anno. Latin America & Caribbean (excluding high income). I dati fino ad 2001 anno non disponibili. Il numero di osservazioni attuali secondo i date: 15.
La fonte (nome):
Indicatori dello sviluppo mondiale
La fonte (organizzazione):
World Bank, International Debt Statistics.
Categorie:
External Debt
sono stati aggiornati
23 apr 2017 anni
Indicatori delle variazioni dei valori per anni
In media:
9.177
Minima:
6.325
1 gen 2015 anni
Massimo:
11.682
1 gen 2005 anni
Alla data di osservazione
Valore
Variazione assoluta
La variazione rispetto al valore precedente
1 gen 2002 anni
10.462
+10.462
0.0%
1 gen 2003 anni
11.071
+0.609
5.82%
1 gen 2004 anni
11.179
+0.108
0.98%
1 gen 2005 anni
11.682
+0.502
4.49%
1 gen 2006 anni
9.295
-2.387
-20.43%
1 gen 2007 anni
10.498
+1.203
12.94%
1 gen 2008 anni
11.044
+0.546
5.2%
1 gen 2009 anni
9.879
-1.165
-10.55%
1 gen 2010 anni
10.845
+0.965
9.77%
1 gen 2011 anni
8.319
-2.526
-23.29%
1 gen 2012 anni
7.092
-1.227
-14.75%
1 gen 2013 anni
6.675
-0.417
-5.88%
1 gen 2014 anni
6.871
+0.197
2.95%
1 gen 2015 anni
6.325
-0.547
-7.96%
1 gen 2016 anni
6.42
+0.096
1.52%
Classificazione dei paesi secondo i statistiche attuali per anni