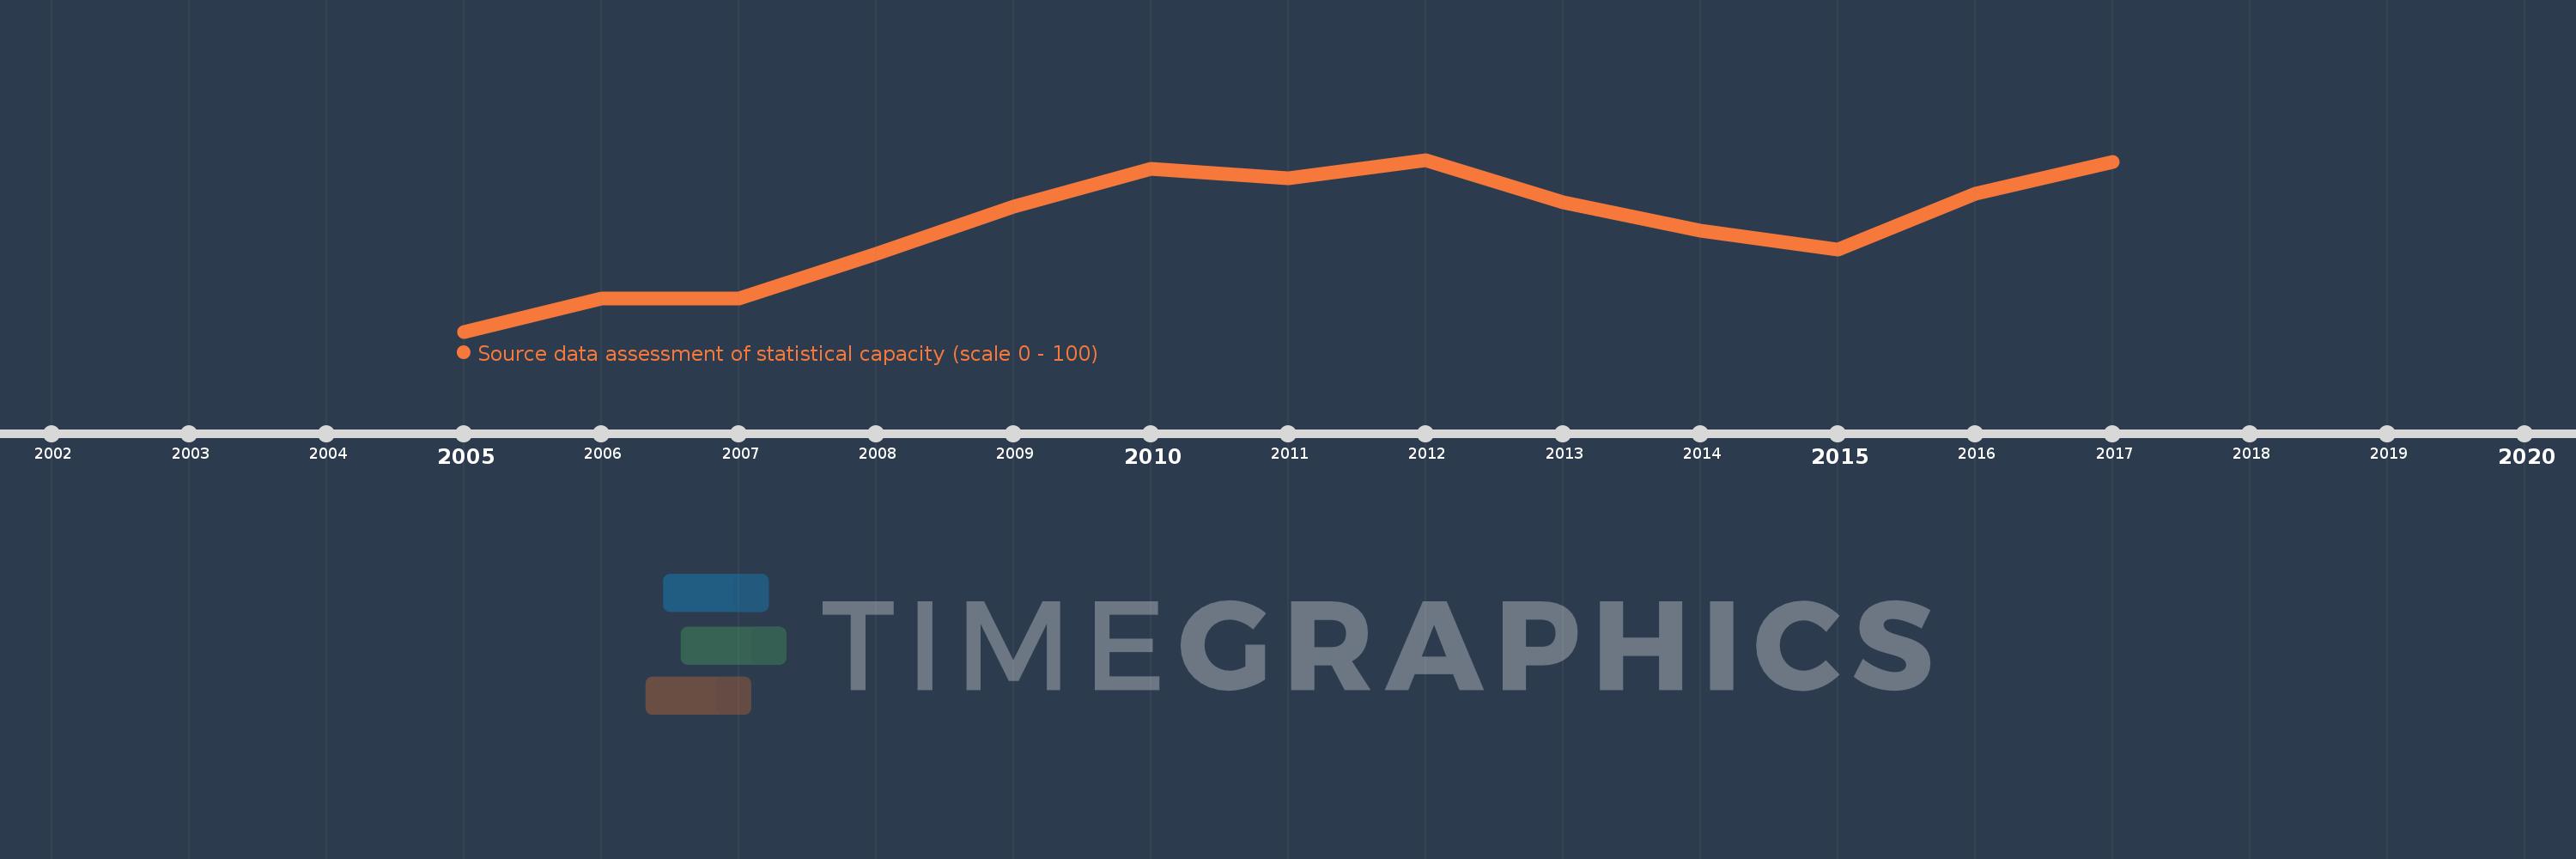
Questa scala temporale mostra un grafico dal 2005 anno al 2017 anno. IDA & IBRD total. I dati fino ad 2004 anno non disponibili. Il numero di osservazioni attuali secondo i date: 13.
La fonte (nome):
Indicatori dello sviluppo mondiale
La fonte (organizzazione):
World Bank
Categorie:
Public Sector
sono stati aggiornati
23 apr 2017 anni
Indicatori delle variazioni dei valori per anni
In media:
65.748
Minima:
63.75
1 gen 2005 anni
Massimo:
66.991
1 gen 2012 anni
Alla data di osservazione
Valore
Variazione assoluta
La variazione rispetto al valore precedente
1 gen 2005 anni
63.75
+63.75
0.0%
1 gen 2006 anni
64.375
+0.625
0.98%
1 gen 2007 anni
64.375
0.0
0.0%
1 gen 2008 anni
65.221
+0.846
1.31%
1 gen 2009 anni
66.106
+0.885
1.36%
1 gen 2010 anni
66.814
+0.708
1.07%
1 gen 2011 anni
66.637
-0.177
-0.26%
1 gen 2012 anni
66.991
+0.354
0.53%
1 gen 2013 anni
66.195
-0.796
-1.19%
1 gen 2014 anni
65.652
-0.543
-0.82%
1 gen 2015 anni
65.304
-0.348
-0.53%
1 gen 2016 anni
66.348
+1.043
1.6%
1 gen 2017 anni
66.957
+0.609
0.92%
Classificazione dei paesi secondo i statistiche attuali per anni