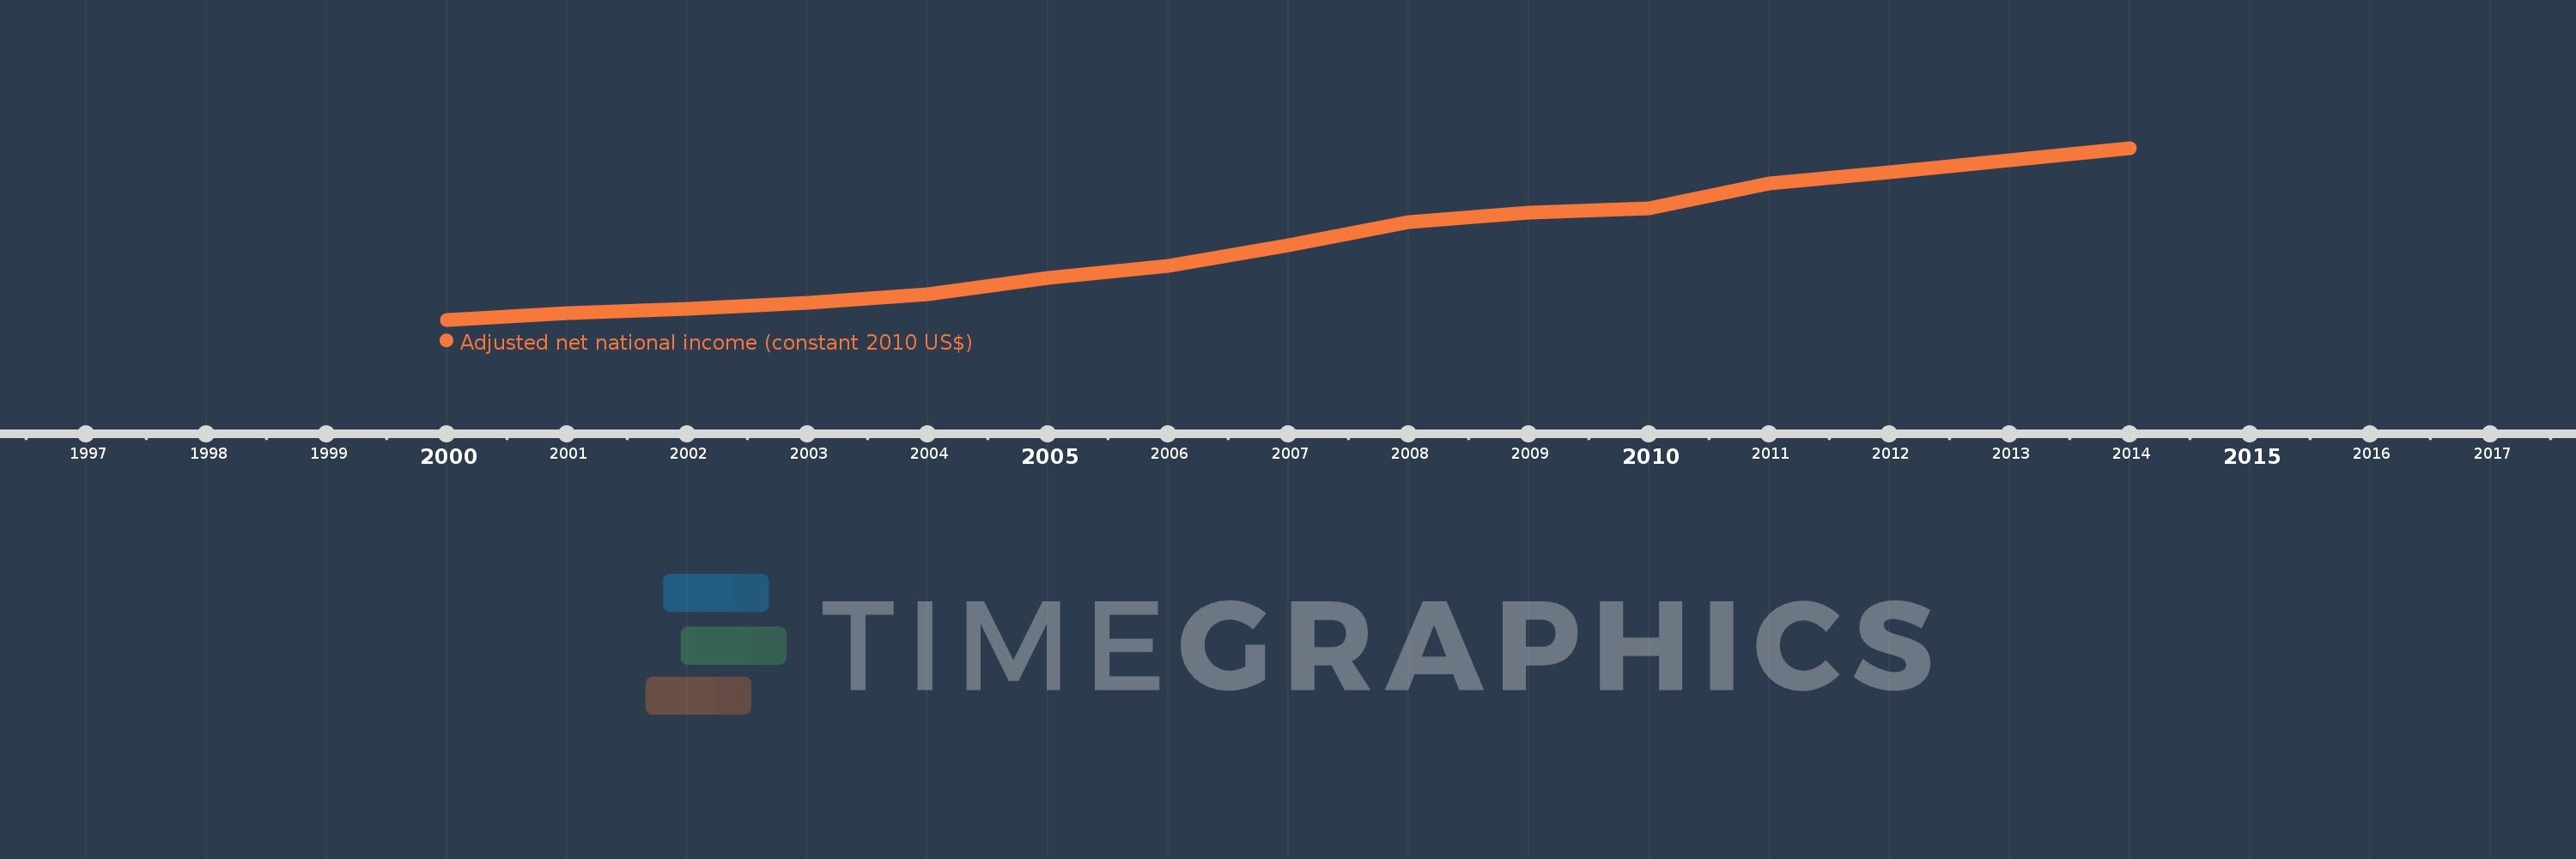
Questa scala temporale mostra un grafico dal 2000 anno al 2014 anno. IDA & IBRD total. I dati fino ad 1999 anno non disponibili. Il numero di osservazioni attuali secondo i date: 15.
La fonte (nome):
Indicatori dello sviluppo mondiale
La fonte (organizzazione):
World Bank staff estimates based on sources and methods in World Bank's "The Changing Wealth of Nations: Measuring Sustainable Development in the New Millennium" (2011).
Categorie:
Economy & Growth
sono stati aggiornati
23 apr 2017 anni
Indicatori delle variazioni dei valori per anni
In media:
14.497 Trln
Minima:
10.34 Trln
1 gen 2000 anni
Massimo:
19.575 Trln
1 gen 2014 anni
Alla data di osservazione
Valore
Variazione assoluta
La variazione rispetto al valore precedente
1 gen 2000 anni
10.34 Trln
+10.34 Trln
0.0%
1 gen 2001 anni
10.707 Trln
+367.12 Mlrd
3.55%
1 gen 2002 anni
10.911 Trln
+203.867 Mlrd
1.9%
1 gen 2003 anni
11.241 Trln
+330.55 Mlrd
3.03%
1 gen 2004 anni
11.699 Trln
+458.087 Mlrd
4.08%
1 gen 2005 anni
12.599 Trln
+899.47 Mlrd
7.69%
1 gen 2006 anni
13.255 Trln
+655.752 Mlrd
5.2%
1 gen 2007 anni
14.327 Trln
+1.072 Trln
8.09%
1 gen 2008 anni
15.574 Trln
+1.247 Trln
8.7%
1 gen 2009 anni
16.105 Trln
+531.26 Mlrd
3.41%
1 gen 2010 anni
16.307 Trln
+202.235 Mlrd
1.26%
1 gen 2011 anni
17.668 Trln
+1.36 Trln
8.34%
1 gen 2012 anni
18.248 Trln
+580.462 Mlrd
3.29%
1 gen 2013 anni
18.899 Trln
+650.771 Mlrd
3.57%
1 gen 2014 anni
19.575 Trln
+675.848 Mlrd
3.58%
Classificazione dei paesi secondo i statistiche attuali per anni