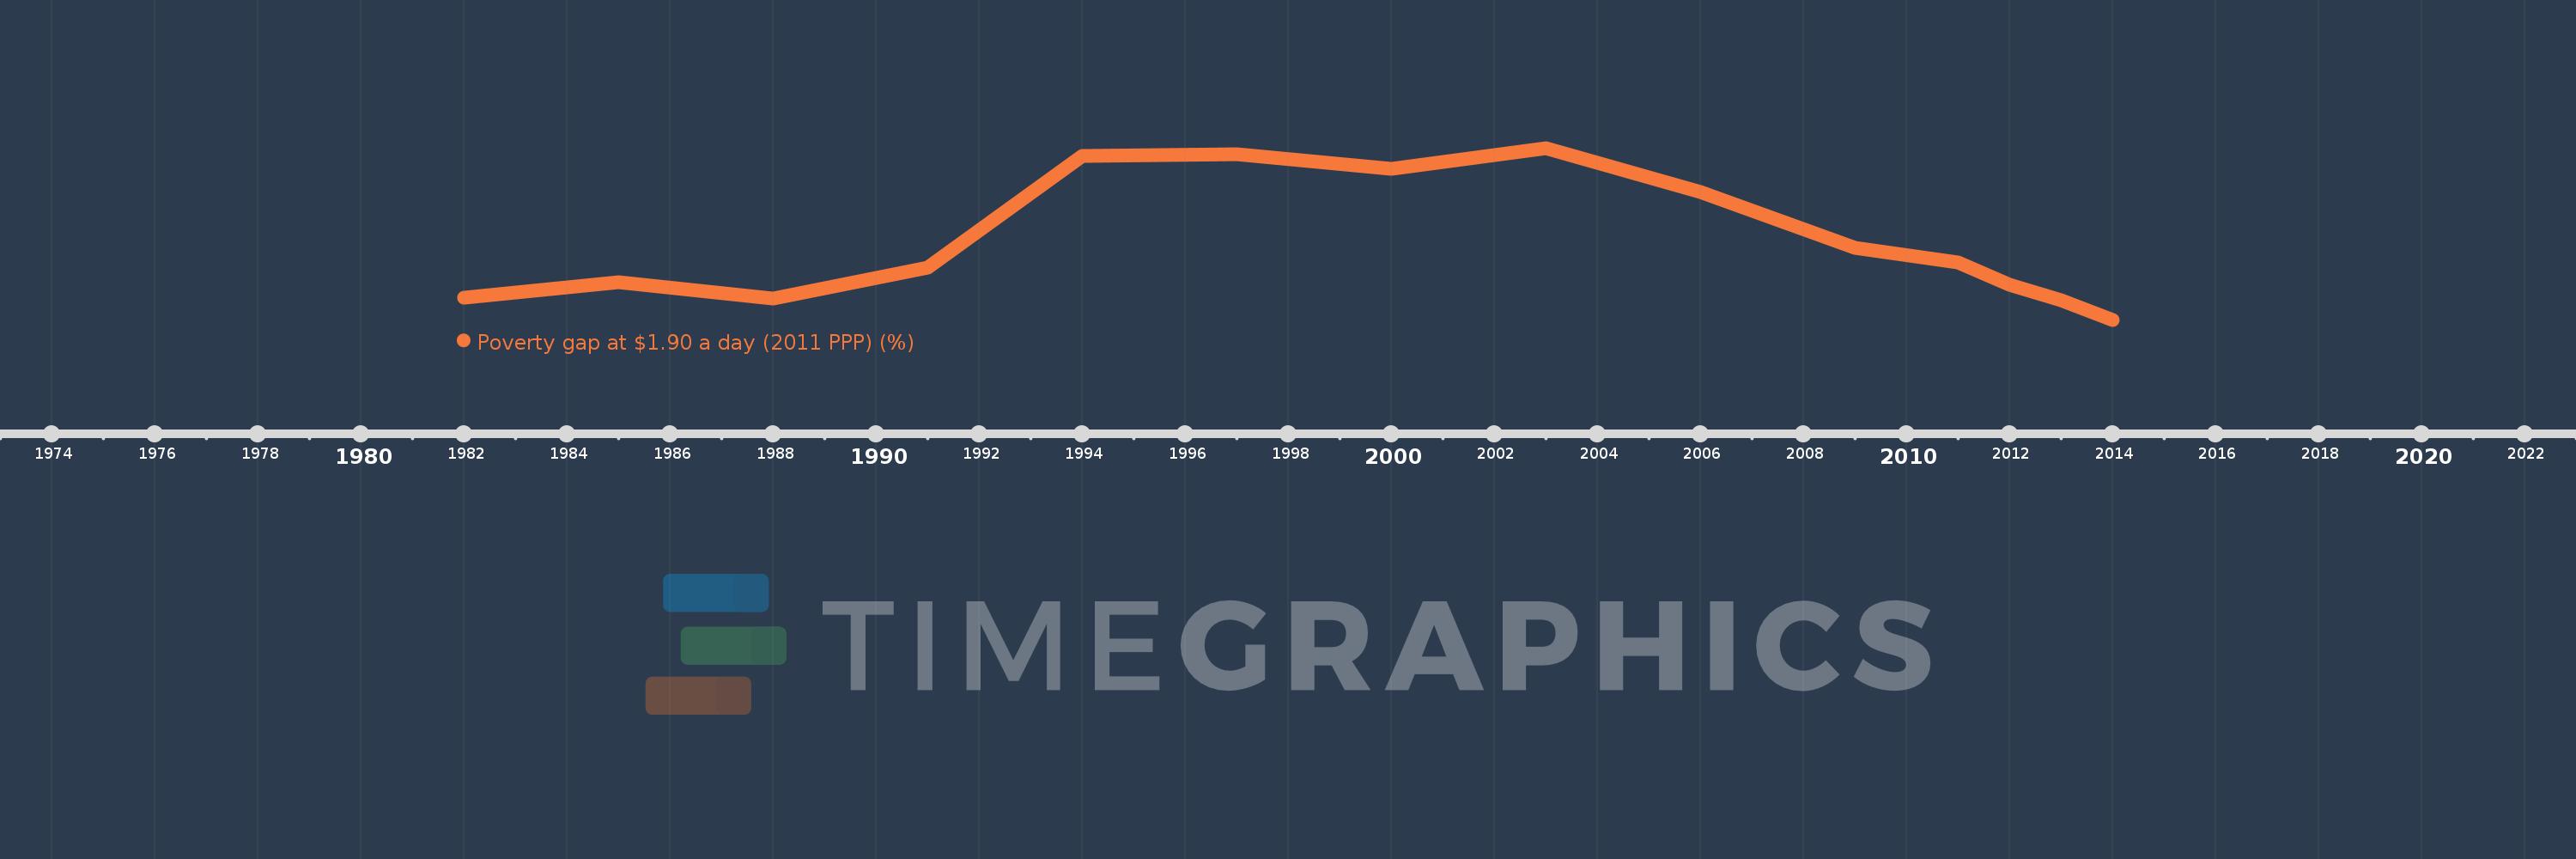
Questa scala temporale mostra un grafico dal 1982 anno al 2014 anno. Fragile and conflict affected situations. I dati fino ad 1981 anno non disponibili. Il numero di osservazioni attuali secondo i date: 14.
La fonte (nome):
Indicatori dello sviluppo mondiale
La fonte (organizzazione):
World Bank, Development Research Group. Data are based on primary household survey data obtained from government statistical agencies and World Bank country departments. Data for high-income economies are from the Luxembourg Income Study database. For more information and methodology, please see PovcalNet (http://iresearch.worldbank.org/PovcalNet/index.htm).
Categorie:
Poverty
sono stati aggiornati
23 apr 2017 anni
Indicatori delle variazioni dei valori per anni
In media:
20.194
Minima:
17.42
1 gen 2014 anni
Massimo:
23.5
1 gen 2003 anni
Alla data di osservazione
Valore
Variazione assoluta
La variazione rispetto al valore precedente
1 gen 1982 anni
18.21
+18.21
0.0%
1 gen 1985 anni
18.75
+0.54
2.97%
1 gen 1988 anni
18.18
-0.57
-3.04%
1 gen 1991 anni
19.28
+1.1
6.05%
1 gen 1994 anni
23.22
+3.94
20.44%
1 gen 1997 anni
23.28
+0.06
0.26%
1 gen 2000 anni
22.75
-0.53
-2.28%
1 gen 2003 anni
23.5
+0.75
3.3%
1 gen 2006 anni
21.93
-1.57
-6.68%
1 gen 2009 anni
19.96
-1.97
-8.98%
1 gen 2011 anni
19.44
-0.52
-2.61%
1 gen 2012 anni
18.67
-0.77
-3.96%
1 gen 2013 anni
18.12
-0.55
-2.95%
1 gen 2014 anni
17.42
-0.7
-3.86%
Classificazione dei paesi secondo i statistiche attuali per anni