30
/it/
AIzaSyAYiBZKx7MnpbEhh9jyipgxe19OcubqV5w
April 1, 2024
34201
Fragile and conflict affected situations
FCS
false
2
1
Firms that do not report all sales for tax purposes (% of firms)
2011,2010,2008,2007,2004
Download
Biblioteca di statistiche globali →Fragile and conflict affected situations →

Firms that do not report all sales for tax purposes (% of firms)

Queste statistiche in altri paesi:

AlbaniaAlgeriaAngolaArab WorldArgentinaArmeniaAzerbaijanBelarusBeninBoliviaBosnia and HerzegovinaBotswanaBulgariaBurkina FasoBurundiCabo VerdeCambodiaCameroonCaribbean small statesCentral Europe and the BalticsChileChinaColombiaCongo, Dem. Rep.Congo, Rep.Costa RicaCote d'IvoireCroatiaCzech RepublicDominican RepublicEarly-demographic dividendEast Asia & PacificEast Asia & Pacific (excluding high income)East Asia & Pacific (IDA & IBRD countries)EcuadorEgypt, Arab Rep.El SalvadorEstoniaEthiopiaEuro areaEurope & Central AsiaEurope & Central Asia (excluding high income)Europe & Central Asia (IDA & IBRD countries)European UnionFragile and conflict affected situationsGabonGambia, TheGeorgiaGhanaGreeceGuatemalaGuineaGuinea-BissauGuyanaHeavily indebted poor countries (HIPC)High incomeHondurasHungaryIBRD onlyIDA & IBRD totalIDA blendIDA onlyIDA totalIndiaIndonesiaIrelandJamaicaJordanKazakhstanKenyaKorea, Rep.Kyrgyz RepublicLao PDRLate-demographic dividendLatin America & Caribbean Latin America & Caribbean (excluding high income)Latin America & the Caribbean (IDA & IBRD countries)LatviaLeast developed countries: UN classificationLebanonLiberiaLithuaniaLow & middle incomeLow incomeLower middle incomeMacedonia, FYRMadagascarMalawiMaliMauritaniaMauritiusMexicoMiddle East & North AfricaMiddle East & North Africa (excluding high income)Middle East & North Africa (IDA & IBRD countries)Middle incomeMoldovaMongoliaMontenegroMozambiqueNamibiaNicaraguaNigerNigeriaOECD membersOmanOther small statesPakistanPanamaParaguayPeruPolandPortugalPost-demographic dividendPre-demographic dividendRomaniaRussian FederationRwandaSenegalSerbiaSierra LeoneSlovak RepublicSloveniaSmall statesSouth AfricaSouth AsiaSouth Asia (IDA & IBRD)SpainSri LankaSub-Saharan Africa Sub-Saharan Africa (excluding high income)Sub-Saharan Africa (IDA & IBRD countries)SwazilandSyrian Arab RepublicTajikistanTanzaniaTurkeyUgandaUkraineUpper middle incomeUruguayUzbekistanVietnamWest Bank and GazaWorldYemen, Rep.Zambia

Linea del tempo:

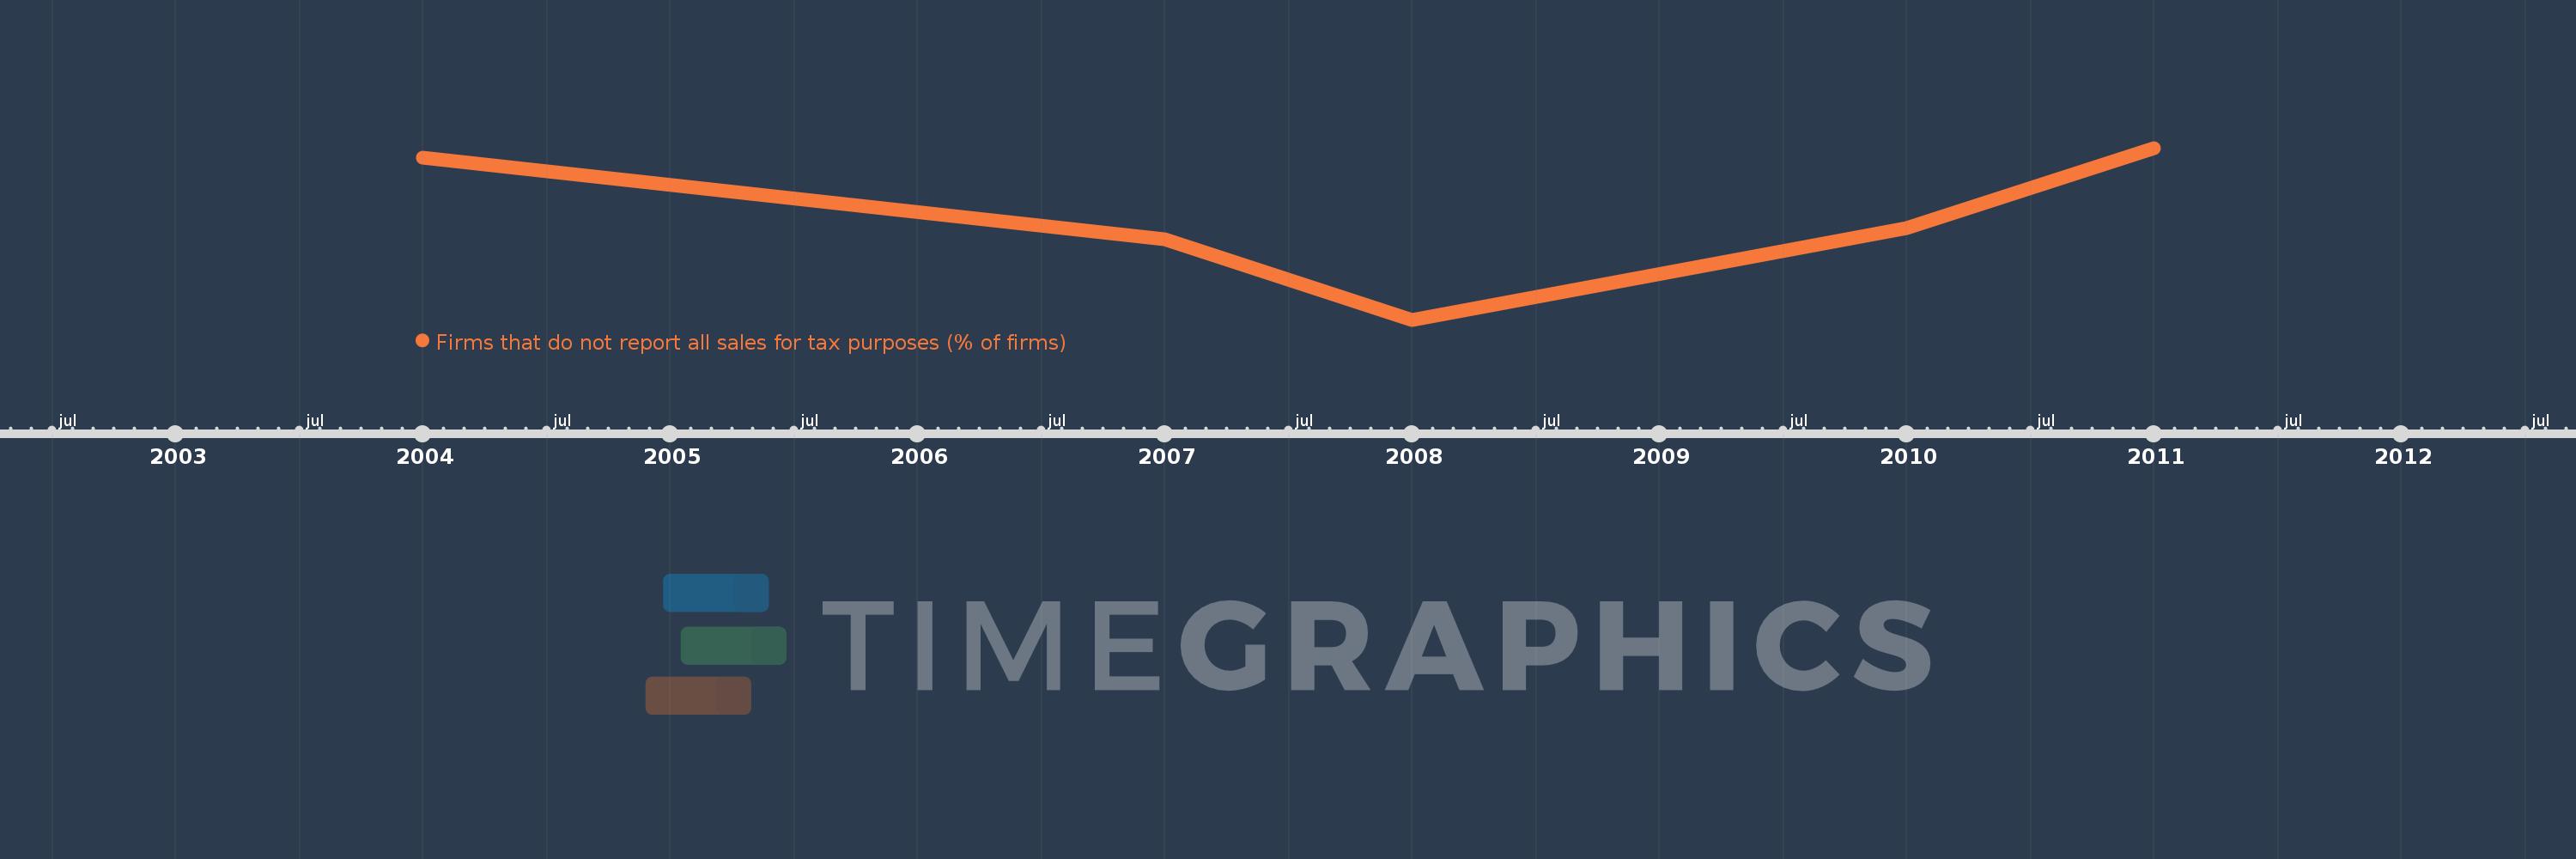
Questa scala temporale mostra un grafico dal 2004 anno al 2011 anno. Fragile and conflict affected situations. I dati fino ad 2003 anno non disponibili. Il numero di osservazioni attuali secondo i date: 5.

La fonte (nome):

Indicatori dello sviluppo mondiale

La fonte (organizzazione):

World Bank, Enterprise Surveys (http://www.enterprisesurveys.org/).

Categorie:

Private Sector

sono stati aggiornati

23 apr 2017 anni

Indicatori delle variazioni dei valori per anni

In media:
64.798
Minima:
39.71
1 gen 2008 anni
Massimo:
82.33
1 gen 2011 anni
Alla data di osservazione
Valore
Variazione assoluta
La variazione rispetto al valore precedente
1 gen 2004 anni
79.87
+79.87
0.0%
1 gen 2007 anni
59.59
-20.28
-25.39%
1 gen 2008 anni
39.71
-19.88
-33.36%
1 gen 2010 anni
62.492
+22.782
57.37%
1 gen 2011 anni
82.33
+19.838
31.75%

Classificazione dei paesi secondo i statistiche attuali per anni