29
/it/
it
AIzaSyAYiBZKx7MnpbEhh9jyipgxe19OcubqV5w
April 1, 2024
34131
Fragile and conflict affected situations
FCS
false
2
1
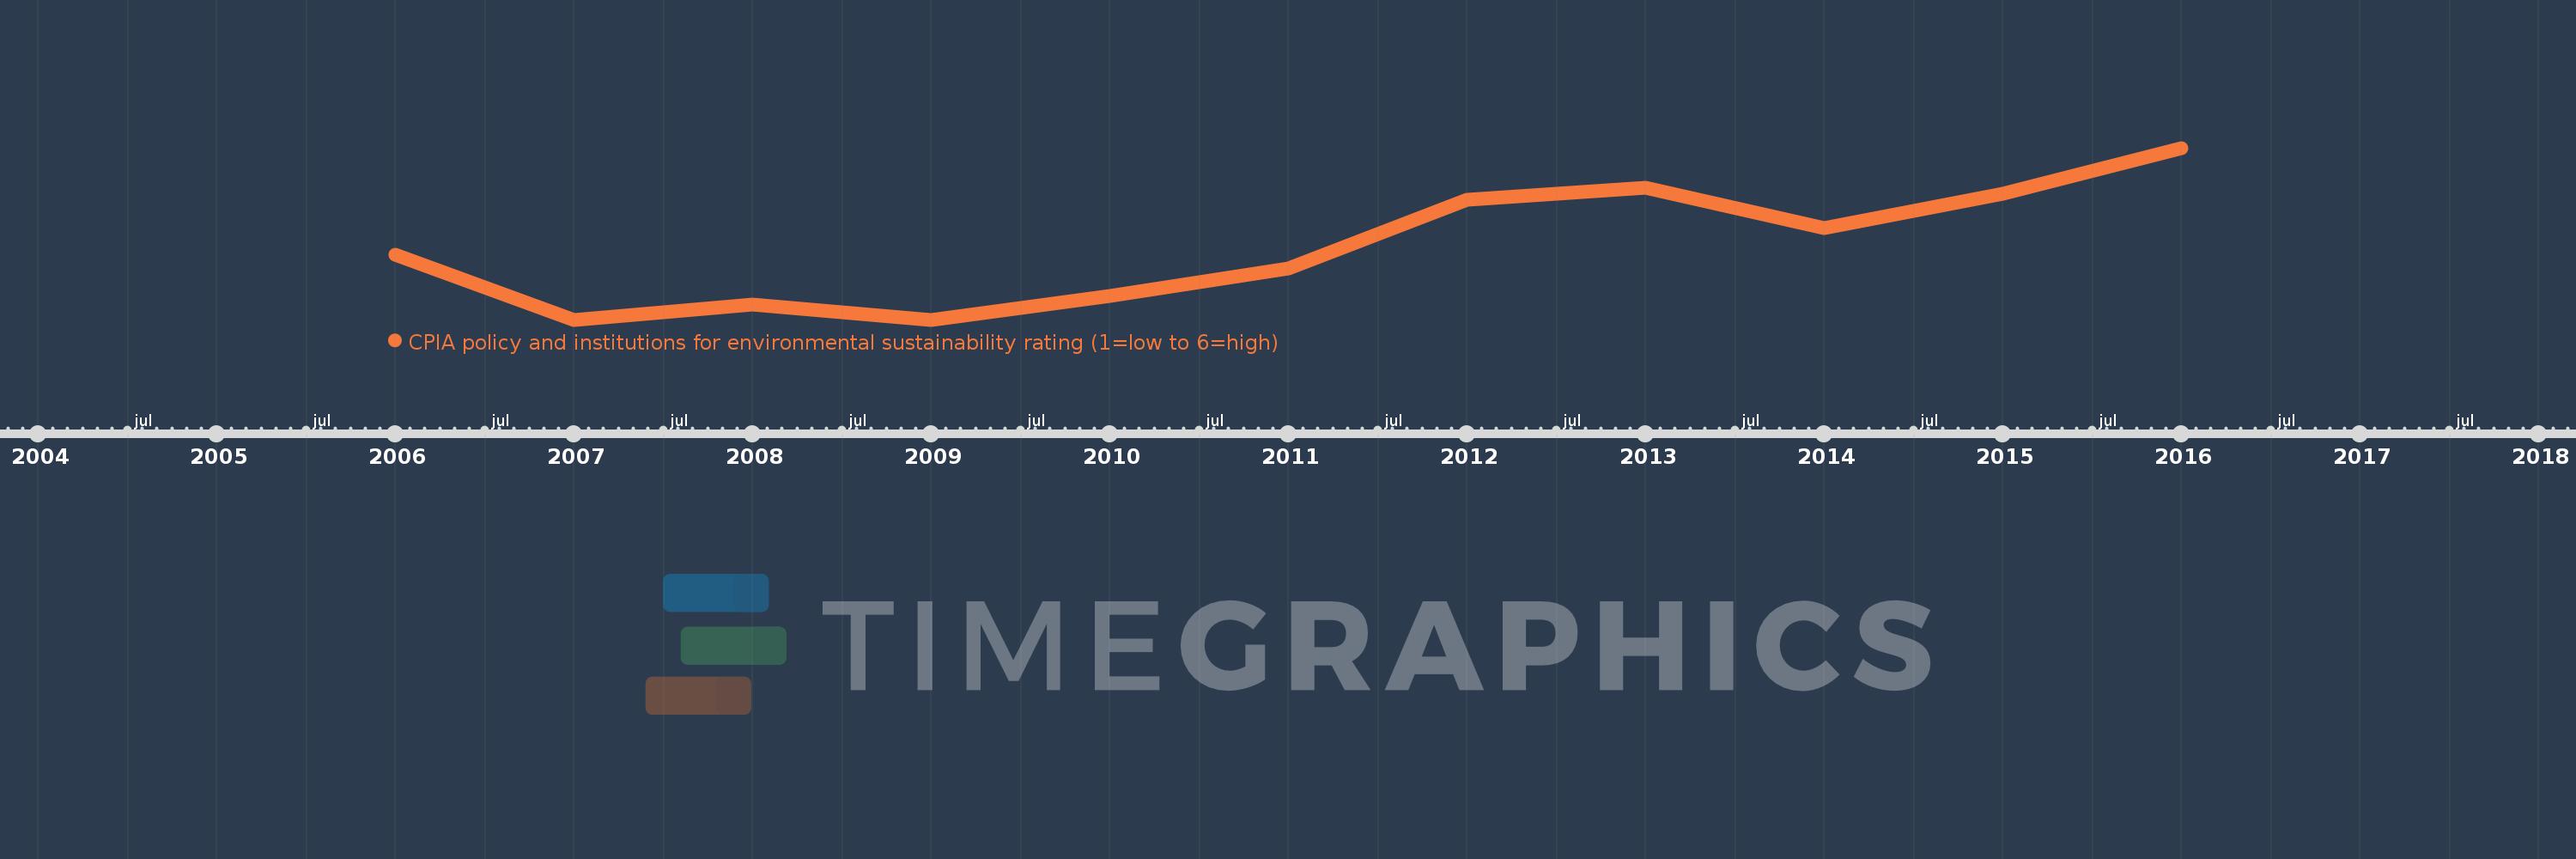
CPIA policy and institutions for environmental sustainability rating (1=low to 6=high)
2016,2015,2014,2013,2012,2011,2010,2009,2008,2007,2006
Queste statistiche in altri paesi:
Linea del tempo:
Questa scala temporale mostra un grafico dal 2006 anno al 2016 anno. Fragile and conflict affected situations. I dati fino ad 2005 anno non disponibili. Il numero di osservazioni attuali secondo i date: 11.
La fonte (nome):
Indicatori dello sviluppo mondiale
La fonte (organizzazione):
World Bank Group, CPIA database (http://www.worldbank.org/ida).
Categorie:
Public Sector
sono stati aggiornati
23 apr 2017 anni
Indicatori delle variazioni dei valori per anni
Minima:
2.568
1 gen 2007 anni
Massimo:
2.828
1 gen 2016 anni
Alla data di osservazione
Valore
Variazione assoluta
La variazione rispetto al valore precedente
1 gen 2006 anni
2.667
+2.667
0.0%
1 gen 2007 anni
2.568
-0.098
-3.69%
1 gen 2008 anni
2.591
+0.023
0.88%
1 gen 2009 anni
2.568
-0.023
-0.88%
1 gen 2010 anni
2.604
+0.036
1.4%
1 gen 2011 anni
2.646
+0.042
1.6%
1 gen 2012 anni
2.75
+0.104
3.94%
1 gen 2013 anni
2.768
+0.018
0.65%
1 gen 2014 anni
2.707
-0.061
-2.2%
1 gen 2015 anni
2.759
+0.052
1.91%
1 gen 2016 anni
2.828
+0.069
2.5%
Classificazione dei paesi secondo i statistiche attuali per anni
Commenti: