33
/it/
AIzaSyAYiBZKx7MnpbEhh9jyipgxe19OcubqV5w
August 1, 2025
33498
European Union
EUU
false
2
1
Hospital beds (per 1,000 people)
2012,2011,2010,2009,2007,2006,2003,2002,2001,2000,1999,1998,1997,1996,1995,1994,1993,1992,1991,1986,1981,1971
Download
Biblioteca di statistiche globali →European Union →

Hospital beds (per 1,000 people)

Queste statistiche in altri paesi:

AfghanistanAlbaniaAlgeriaAndorraAngolaAntigua and BarbudaArab WorldArgentinaArmeniaAustraliaAustriaAzerbaijanBahamas, TheBahrainBangladeshBarbadosBelarusBelgiumBelizeBeninBermudaBhutanBoliviaBosnia and HerzegovinaBotswanaBrazilBrunei DarussalamBulgariaBurkina FasoBurundiCabo VerdeCambodiaCameroonCanadaCaribbean small statesCayman IslandsCentral African RepublicCentral Europe and the BalticsChadChannel IslandsChileChinaColombiaComorosCongo, Dem. Rep.Congo, Rep.Costa RicaCote d'IvoireCroatiaCubaCyprusCzech RepublicDenmarkDjiboutiDominicaDominican RepublicEarly-demographic dividendEast Asia & PacificEast Asia & Pacific (excluding high income)East Asia & Pacific (IDA & IBRD countries)EcuadorEgypt, Arab Rep.El SalvadorEquatorial GuineaEritreaEstoniaEthiopiaEuro areaEurope & Central AsiaEurope & Central Asia (excluding high income)Europe & Central Asia (IDA & IBRD countries)European UnionFijiFinlandFragile and conflict affected situationsFranceGabonGambia, TheGeorgiaGermanyGhanaGreeceGreenlandGrenadaGuatemalaGuineaGuinea-BissauGuyanaHaitiHeavily indebted poor countries (HIPC)High incomeHondurasHong Kong SAR, ChinaHungaryIBRD onlyIcelandIDA & IBRD totalIDA blendIDA onlyIDA totalIndiaIndonesiaIran, Islamic Rep.IraqIrelandIsraelItalyJamaicaJapanJordanKazakhstanKenyaKiribatiKorea, Dem. People’s Rep.Korea, Rep.KuwaitKyrgyz RepublicLao PDRLate-demographic dividendLatin America & Caribbean Latin America & Caribbean (excluding high income)Latin America & the Caribbean (IDA & IBRD countries)LatviaLeast developed countries: UN classificationLebanonLesothoLiberiaLibyaLithuaniaLow & middle incomeLow incomeLower middle incomeLuxembourgMacao SAR, ChinaMacedonia, FYRMadagascarMalawiMalaysiaMaldivesMaliMaltaMarshall IslandsMauritaniaMauritiusMexicoMicronesia, Fed. Sts.Middle East & North AfricaMiddle East & North Africa (excluding high income)Middle East & North Africa (IDA & IBRD countries)Middle incomeMoldovaMonacoMongoliaMontenegroMoroccoMozambiqueMyanmarNamibiaNauruNepalNetherlandsNew ZealandNicaraguaNigerNigeriaNorth AmericaNorwayOECD membersOmanPacific island small statesPakistanPalauPanamaPapua New GuineaParaguayPeruPhilippinesPolandPortugalPost-demographic dividendPre-demographic dividendPuerto RicoQatarRomaniaRussian FederationRwandaSamoaSan MarinoSao Tome and PrincipeSaudi ArabiaSenegalSerbiaSeychellesSierra LeoneSingaporeSlovak RepublicSloveniaSmall statesSolomon IslandsSomaliaSouth AfricaSouth AsiaSouth Asia (IDA & IBRD)SpainSri LankaSt. Kitts and NevisSt. LuciaSt. Vincent and the GrenadinesSub-Saharan Africa Sub-Saharan Africa (excluding high income)Sub-Saharan Africa (IDA & IBRD countries)SudanSurinameSwazilandSwedenSwitzerlandSyrian Arab RepublicTajikistanTanzaniaThailandTimor-LesteTogoTongaTrinidad and TobagoTunisiaTurkeyTurkmenistanTuvaluUgandaUkraineUnited Arab EmiratesUnited KingdomUnited StatesUpper middle incomeUruguayUzbekistanVanuatuVenezuela, RBVietnamVirgin Islands (U.S.)West Bank and GazaWorldYemen, Rep.ZambiaZimbabwe

Linea del tempo:

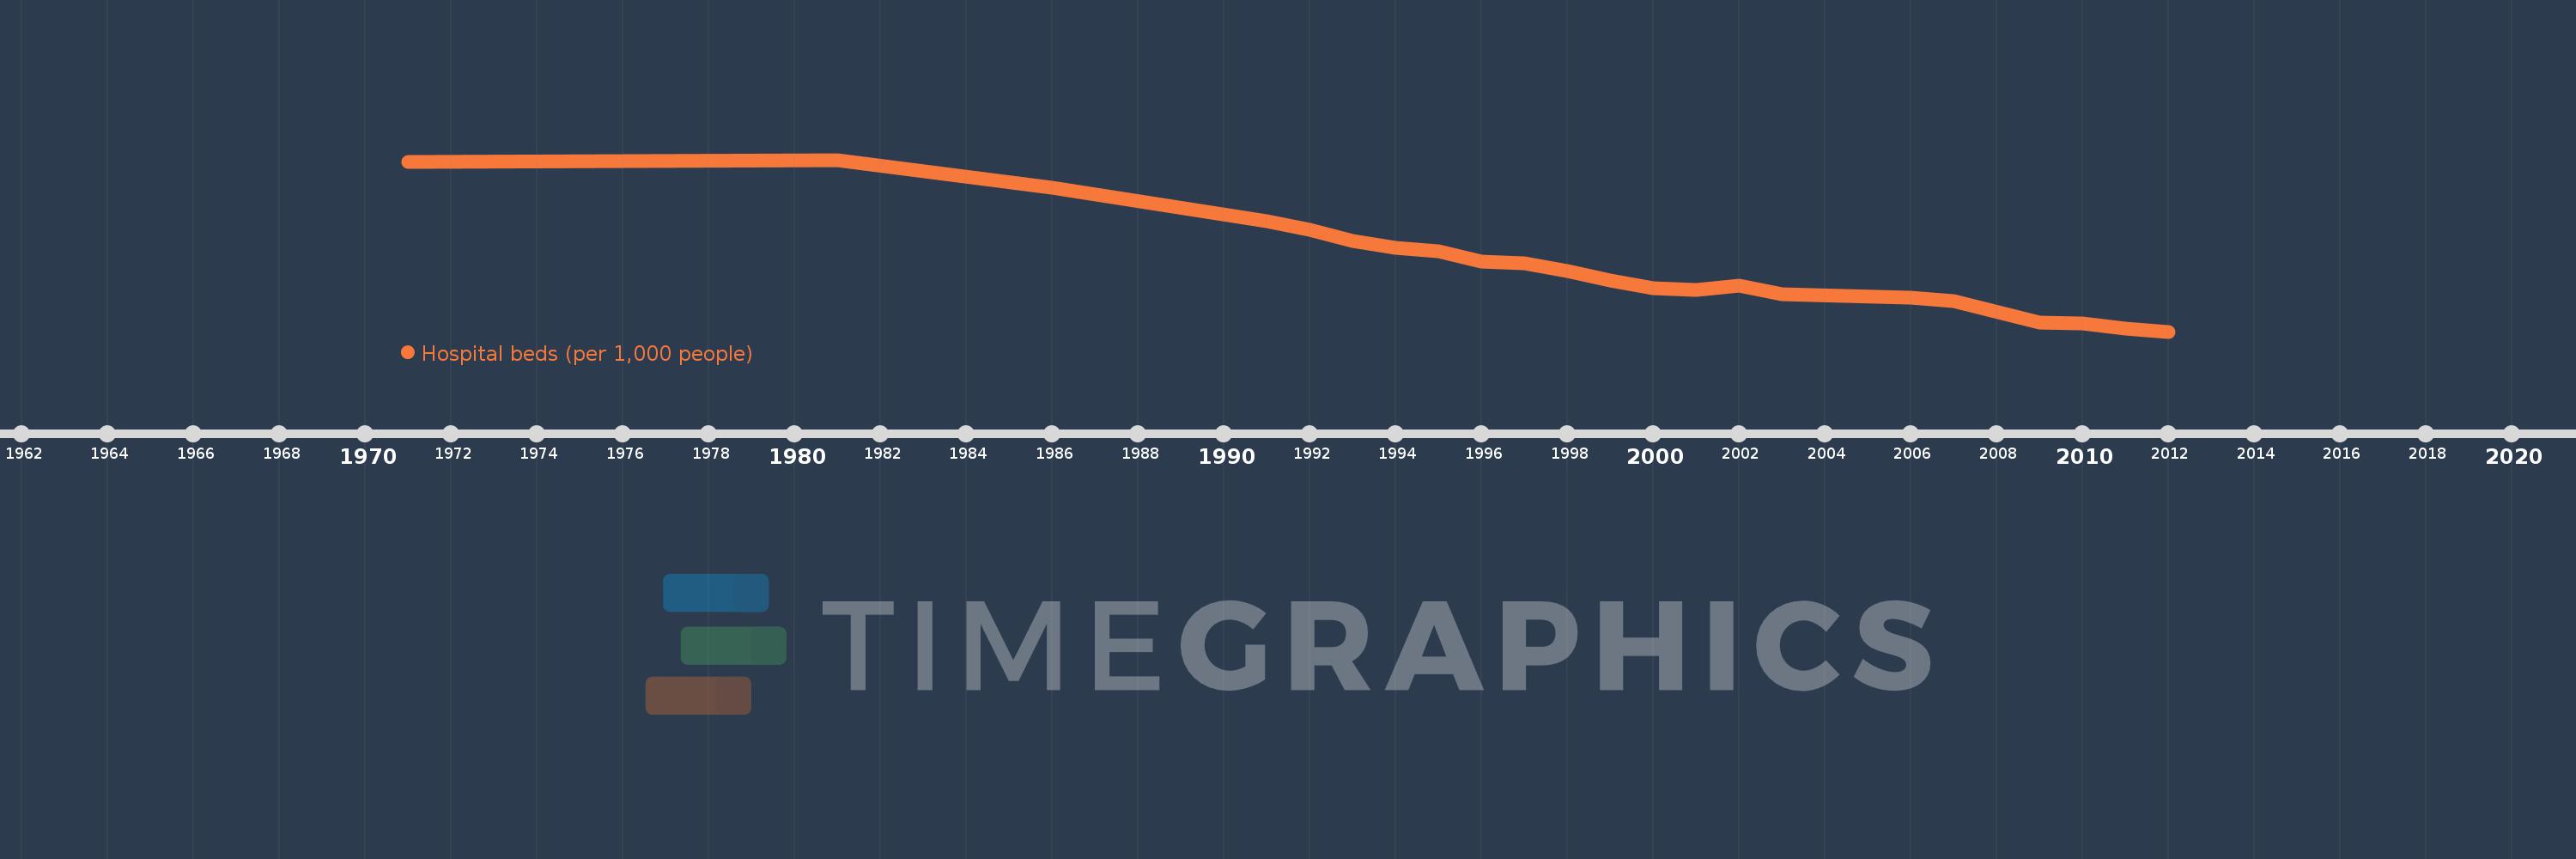
Questa scala temporale mostra un grafico dal 1971 anno al 2012 anno. European Union. I dati fino ad 1970 anno non disponibili. Il numero di osservazioni attuali secondo i date: 22.

La fonte (nome):

Indicatori dello sviluppo mondiale

La fonte (organizzazione):

Data are from the World Health Organization, supplemented by country data.

Categorie:

Health

sono stati aggiornati

23 apr 2017 anni

Indicatori delle variazioni dei valori per anni

In media:
6.896
Minima:
5.372
1 gen 2012 anni
Massimo:
9.333
1 gen 1981 anni
Alla data di osservazione
Valore
Variazione assoluta
La variazione rispetto al valore precedente
1 gen 1971 anni
9.281
+9.281
0.0%
1 gen 1981 anni
9.333
+0.051
0.55%
1 gen 1986 anni
8.691
-0.642
-6.88%
1 gen 1991 anni
7.916
-0.775
-8.91%
1 gen 1992 anni
7.713
-0.203
-2.57%
1 gen 1993 anni
7.46
-0.253
-3.28%
1 gen 1994 anni
7.303
-0.157
-2.11%
1 gen 1995 anni
7.215
-0.087
-1.2%
1 gen 1996 anni
6.993
-0.222
-3.07%
1 gen 1997 anni
6.955
-0.038
-0.55%
1 gen 1998 anni
6.762
-0.193
-2.78%
1 gen 1999 anni
6.56
-0.202
-2.99%
1 gen 2000 anni
6.367
-0.193
-2.94%
1 gen 2001 anni
6.325
-0.042
-0.66%
1 gen 2002 anni
6.431
+0.106
1.67%
1 gen 2003 anni
6.236
-0.195
-3.03%
1 gen 2006 anni
6.147
-0.089
-1.42%
1 gen 2007 anni
6.074
-0.073
-1.18%
1 gen 2009 anni
5.573
-0.501
-8.25%
1 gen 2010 anni
5.555
-0.018
-0.33%
1 gen 2011 anni
5.451
-0.103
-1.86%
1 gen 2012 anni
5.372
-0.08
-1.46%

Classificazione dei paesi secondo i statistiche attuali per anni