29
/it/
it
AIzaSyAYiBZKx7MnpbEhh9jyipgxe19OcubqV5w
April 1, 2024
31517
Europe & Central Asia (excluding high income)
ECA
false
2
1
Employment to population ratio, ages 15-24, total (%) (national estimate)
2015,2013,2012,2011,2010
Download
Biblioteca di statistiche globali →Europe & Central Asia (excluding high income) →

Employment to population ratio, ages 15-24, total (%) (national estimate)

Queste statistiche in altri paesi:
AlbaniaAlgeriaArgentinaArmeniaArubaAustraliaAustriaAzerbaijanBangladeshBarbadosBelarusBelgiumBelizeBeninBhutanBoliviaBosnia and HerzegovinaBotswanaBrazilBulgariaCanadaCayman IslandsCentral Europe and the BalticsChileColombiaCosta RicaCroatiaCyprusCzech RepublicDenmarkDominican RepublicEcuadorEgypt, Arab Rep.El SalvadorEstoniaEthiopiaEuro areaEurope & Central AsiaEurope & Central Asia (excluding high income)Europe & Central Asia (IDA & IBRD countries)European UnionFinlandFranceFrench PolynesiaGabonGambia, TheGeorgiaGermanyGreeceGuamGuatemalaGuineaHigh incomeHondurasHong Kong SAR, ChinaHungaryIcelandIndiaIndonesiaIran, Islamic Rep.IrelandIsle of ManIsraelItalyJapanJordanKiribatiKorea, Rep.KosovoKuwaitKyrgyz RepublicLatin America & Caribbean Latin America & Caribbean (excluding high income)Latin America & the Caribbean (IDA & IBRD countries)LatviaLesothoLibyaLithuaniaLuxembourgMacao SAR, ChinaMacedonia, FYRMadagascarMalawiMalaysiaMaldivesMaliMaltaMauritiusMexicoMoldovaMongoliaMontenegroMoroccoMozambiqueNamibiaNetherlandsNew ZealandNorth AmericaNorwayOECD membersOmanPanamaParaguayPeruPolandPortugalPost-demographic dividendPuerto RicoQatarRomaniaRussian FederationSamoaSaudi ArabiaSenegalSerbiaSeychellesSlovak RepublicSloveniaSouth AfricaSouth AsiaSouth Asia (IDA & IBRD)South SudanSpainSri LankaSt. LuciaSt. Vincent and the GrenadinesSudanSurinameSwedenSwitzerlandSyrian Arab RepublicTanzaniaThailandTimor-LesteTrinidad and TobagoTunisiaTurkeyUkraineUnited KingdomUnited StatesUruguayVenezuela, RBVietnamWest Bank and GazaYemen, Rep.ZambiaZimbabwe
Linea del tempo:
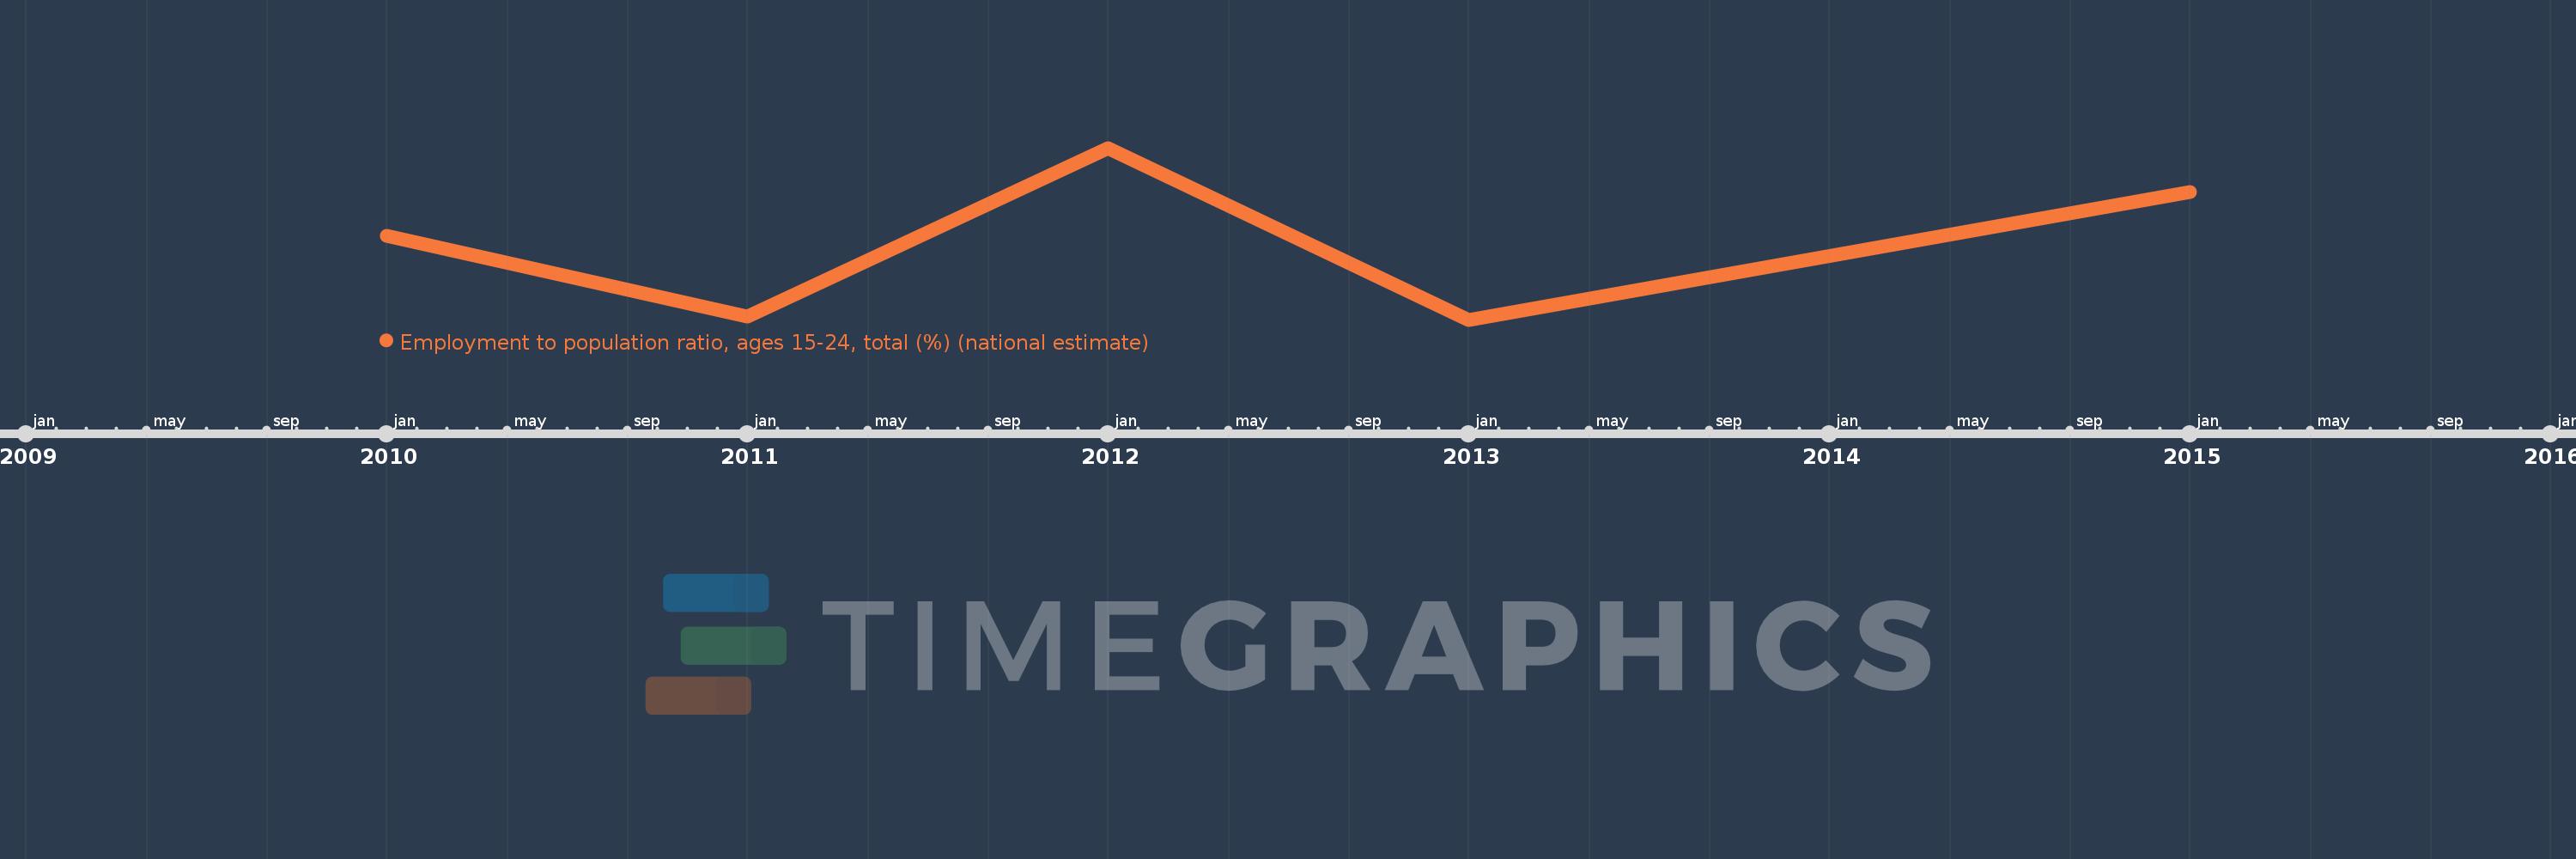
Questa scala temporale mostra un grafico dal 2010 anno al 2015 anno. Europe & Central Asia (excluding high income). I dati fino ad 2009 anno non disponibili. Il numero di osservazioni attuali secondo i date: 5.
La fonte (nome):
Indicatori dello sviluppo mondiale
La fonte (organizzazione):
International Labour Organization, Key Indicators of the Labour Market database.
Categorie:
Social Protection & Labor
sono stati aggiornati
23 apr 2017 anni
Indicatori delle variazioni dei valori per anni
In media:
31.45
Minima:
31.084
1 gen 2013 anni
Massimo:
31.897
1 gen 2012 anni
Alla data di osservazione
Valore
Variazione assoluta
La variazione rispetto al valore precedente
1 gen 2010 anni
31.481
+31.481
0.0%
1 gen 2011 anni
31.098
-0.383
-1.22%
1 gen 2012 anni
31.897
+0.799
2.57%
1 gen 2013 anni
31.084
-0.812
-2.55%
1 gen 2015 anni
31.689
+0.604
1.94%
Classificazione dei paesi secondo i statistiche attuali per anni

Commenti:

Inviare
PremiumAbout & FeedbackAccordoPrivatezza
logo
© 2022 Selected Technologies LLC – Morgan Hill, California