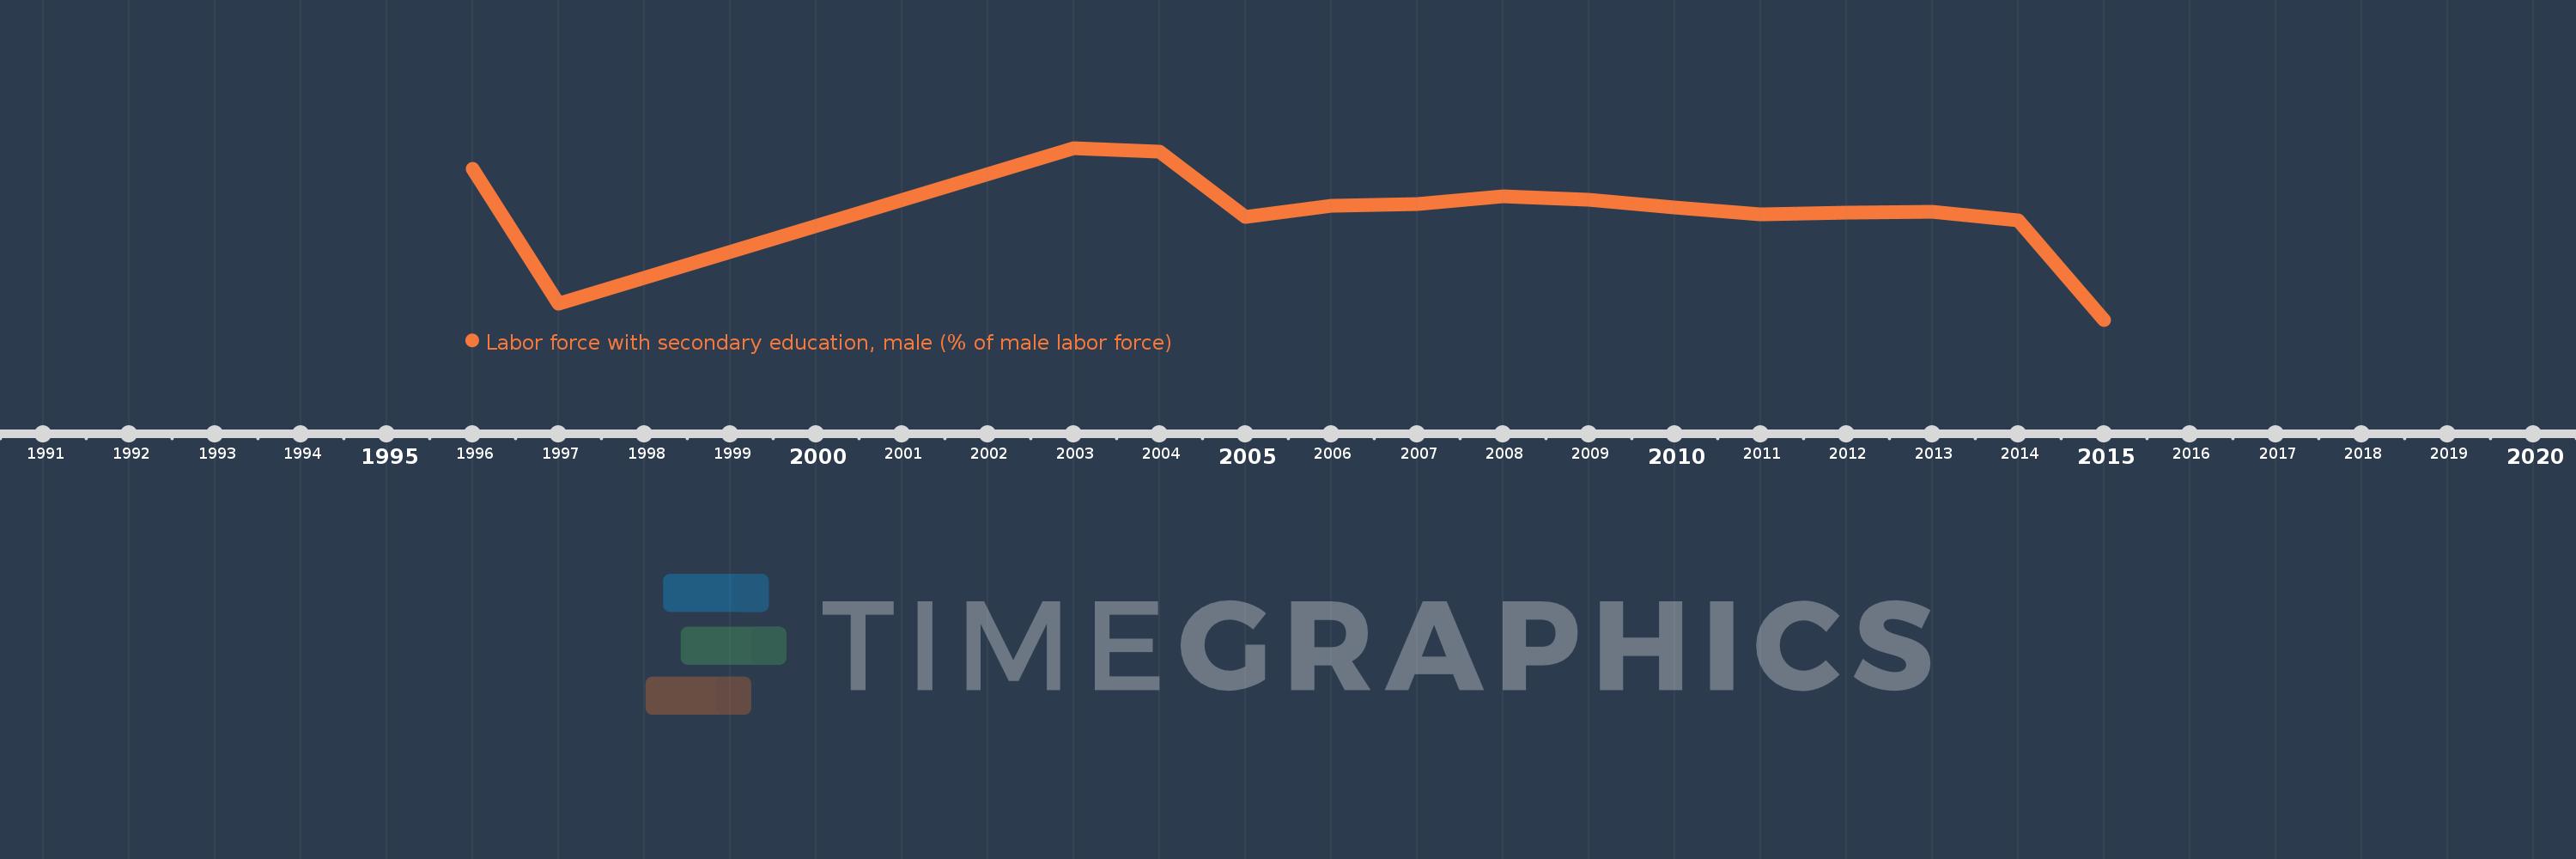
Questa scala temporale mostra un grafico dal 1996 anno al 2015 anno. Europe & Central Asia. I dati fino ad 1995 anno non disponibili. Il numero di osservazioni attuali secondo i date: 15.
La fonte (nome):
Indicatori dello sviluppo mondiale
La fonte (organizzazione):
International Labour Organization, Key Indicators of the Labour Market database.
Categorie:
Education, Social Protection & Labor, Gender
sono stati aggiornati
23 apr 2017 anni
Indicatori delle variazioni dei valori per anni
In media:
47.93
Minima:
42.712
1 gen 2015 anni
Massimo:
51.039
1 gen 2003 anni
Alla data di osservazione
Valore
Variazione assoluta
La variazione rispetto al valore precedente
1 gen 1996 anni
50.032
+50.032
0.0%
1 gen 1997 anni
43.477
-6.555
-13.1%
1 gen 2003 anni
51.039
+7.562
17.39%
1 gen 2004 anni
50.845
-0.194
-0.38%
1 gen 2005 anni
47.709
-3.137
-6.17%
1 gen 2006 anni
48.22
+0.511
1.07%
1 gen 2007 anni
48.328
+0.108
0.22%
1 gen 2008 anni
48.697
+0.369
0.76%
1 gen 2009 anni
48.508
-0.189
-0.39%
1 gen 2010 anni
48.171
-0.337
-0.69%
1 gen 2011 anni
47.823
-0.348
-0.72%
1 gen 2012 anni
47.924
+0.1
0.21%
1 gen 2013 anni
47.929
+0.005
0.01%
1 gen 2014 anni
47.529
-0.399
-0.83%
1 gen 2015 anni
42.712
-4.817
-10.14%
Classificazione dei paesi secondo i statistiche attuali per anni