33
/it/
AIzaSyAYiBZKx7MnpbEhh9jyipgxe19OcubqV5w
August 1, 2025
29775
Euro area
EMU
false
2
1
Employers, male (% of male employment)
2015,2014,2013,2012,2011,2010,2009,2008,2007,2006,2005,2004,2003,2002,2001,2000,1999,1998,1997,1996,1995,1994,1993,1992
Download
Biblioteca di statistiche globali →Euro area →

Employers, male (% of male employment)

Queste statistiche in altri paesi:

AlbaniaAlgeriaAmerican SamoaAntigua and BarbudaArgentinaArmeniaArubaAustriaAzerbaijanBahrainBangladeshBarbadosBelarusBelgiumBelizeBeninBermudaBhutanBoliviaBotswanaBrazilBritish Virgin IslandsBrunei DarussalamBulgariaBurkina FasoBurundiCabo VerdeCambodiaCameroonCaribbean small statesCayman IslandsCentral Europe and the BalticsChadChileColombiaCongo, Rep.Costa RicaCote d'IvoireCroatiaCyprusCzech RepublicDenmarkDjiboutiDominicaDominican RepublicEarly-demographic dividendEcuadorEgypt, Arab Rep.El SalvadorEstoniaEthiopiaEuro areaEurope & Central AsiaEurope & Central Asia (excluding high income)Europe & Central Asia (IDA & IBRD countries)European UnionFijiFinlandFranceGabonGambia, TheGeorgiaGermanyGhanaGreeceGrenadaGuatemalaGuineaHondurasHong Kong SAR, ChinaHungaryIcelandIndiaIndonesiaIran, Islamic Rep.IrelandIsle of ManItalyJamaicaJordanKazakhstanKiribatiKosovoKuwaitKyrgyz RepublicLao PDRLatin America & Caribbean Latin America & Caribbean (excluding high income)Latin America & the Caribbean (IDA & IBRD countries)LatviaLebanonLesothoLiberiaLithuaniaLower middle incomeLuxembourgMacao SAR, ChinaMacedonia, FYRMadagascarMalawiMalaysiaMaldivesMaliMaltaMarshall IslandsMauritiusMiddle East & North Africa (excluding high income)Middle East & North Africa (IDA & IBRD countries)MoldovaMongoliaMoroccoMozambiqueNamibiaNepalNetherlandsNicaraguaNigerNorwayOmanPakistanPanamaParaguayPeruPhilippinesPolandPortugalQatarRomaniaRussian FederationRwandaSamoaSan MarinoSao Tome and PrincipeSaudi ArabiaSenegalSerbiaSeychellesSingaporeSlovak RepublicSloveniaSouth AfricaSouth AsiaSouth Asia (IDA & IBRD)SpainSri LankaSt. Kitts and NevisSt. LuciaSt. Vincent and the GrenadinesSurinameSwazilandSwedenSwitzerlandSyrian Arab RepublicTajikistanTanzaniaThailandTimor-LesteTongaTrinidad and TobagoTunisiaTurkeyTurks and Caicos IslandsTuvaluUgandaUkraineUnited Arab EmiratesUnited KingdomUruguayVanuatuVenezuela, RBVietnamWest Bank and GazaYemen, Rep.ZambiaZimbabwe

Linea del tempo:

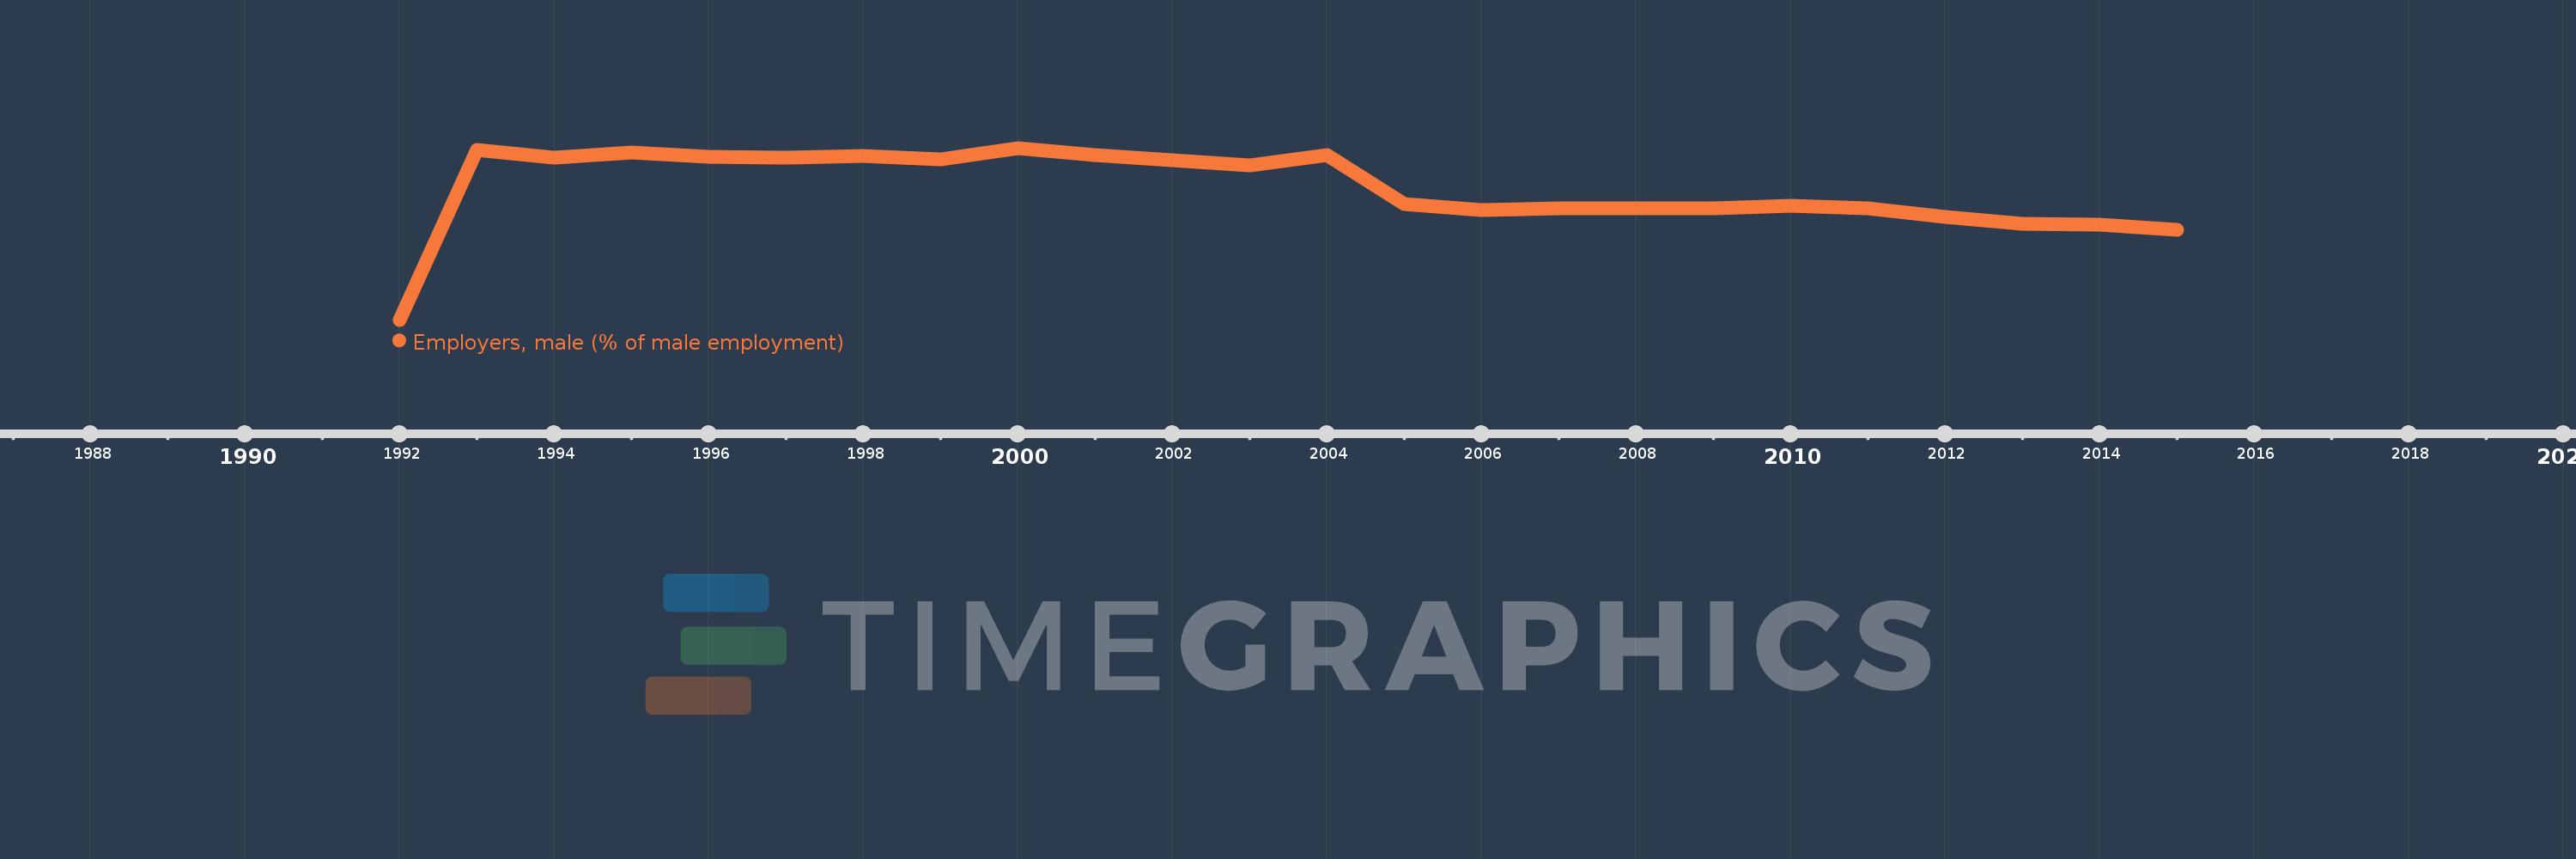
Questa scala temporale mostra un grafico dal 1992 anno al 2015 anno. Euro area. I dati fino ad 1991 anno non disponibili. Il numero di osservazioni attuali secondo i date: 24.

La fonte (nome):

Indicatori dello sviluppo mondiale

La fonte (organizzazione):

ILO Key Indicators of the Labour Market (KILM).

Categorie:

Social Protection & Labor, Gender

sono stati aggiornati

23 apr 2017 anni

Indicatori delle variazioni dei valori per anni

In media:
7.451
Minima:
4.996
1 gen 1992 anni
Massimo:
8.228
1 gen 2000 anni
Alla data di osservazione
Valore
Variazione assoluta
La variazione rispetto al valore precedente
1 gen 1992 anni
4.996
+4.996
0.0%
1 gen 1993 anni
8.189
+3.193
63.92%
1 gen 1994 anni
8.04
-0.149
-1.82%
1 gen 1995 anni
8.149
+0.109
1.35%
1 gen 1996 anni
8.055
-0.094
-1.16%
1 gen 1997 anni
8.05
-0.005
-0.06%
1 gen 1998 anni
8.073
+0.023
0.29%
1 gen 1999 anni
8.018
-0.055
-0.68%
1 gen 2000 anni
8.228
+0.21
2.61%
1 gen 2001 anni
8.095
-0.132
-1.61%
1 gen 2002 anni
7.998
-0.098
-1.21%
1 gen 2003 anni
7.893
-0.105
-1.32%
1 gen 2004 anni
8.088
+0.195
2.47%
1 gen 2005 anni
7.172
-0.916
-11.32%
1 gen 2006 anni
7.054
-0.118
-1.64%
1 gen 2007 anni
7.096
+0.042
0.6%
1 gen 2008 anni
7.085
-0.011
-0.15%
1 gen 2009 anni
7.098
+0.012
0.17%
1 gen 2010 anni
7.139
+0.042
0.59%
1 gen 2011 anni
7.1
-0.04
-0.55%
1 gen 2012 anni
6.936
-0.164
-2.31%
1 gen 2013 anni
6.795
-0.141
-2.03%
1 gen 2014 anni
6.786
-0.009
-0.13%
1 gen 2015 anni
6.694
-0.092
-1.36%

Classificazione dei paesi secondo i statistiche attuali per anni