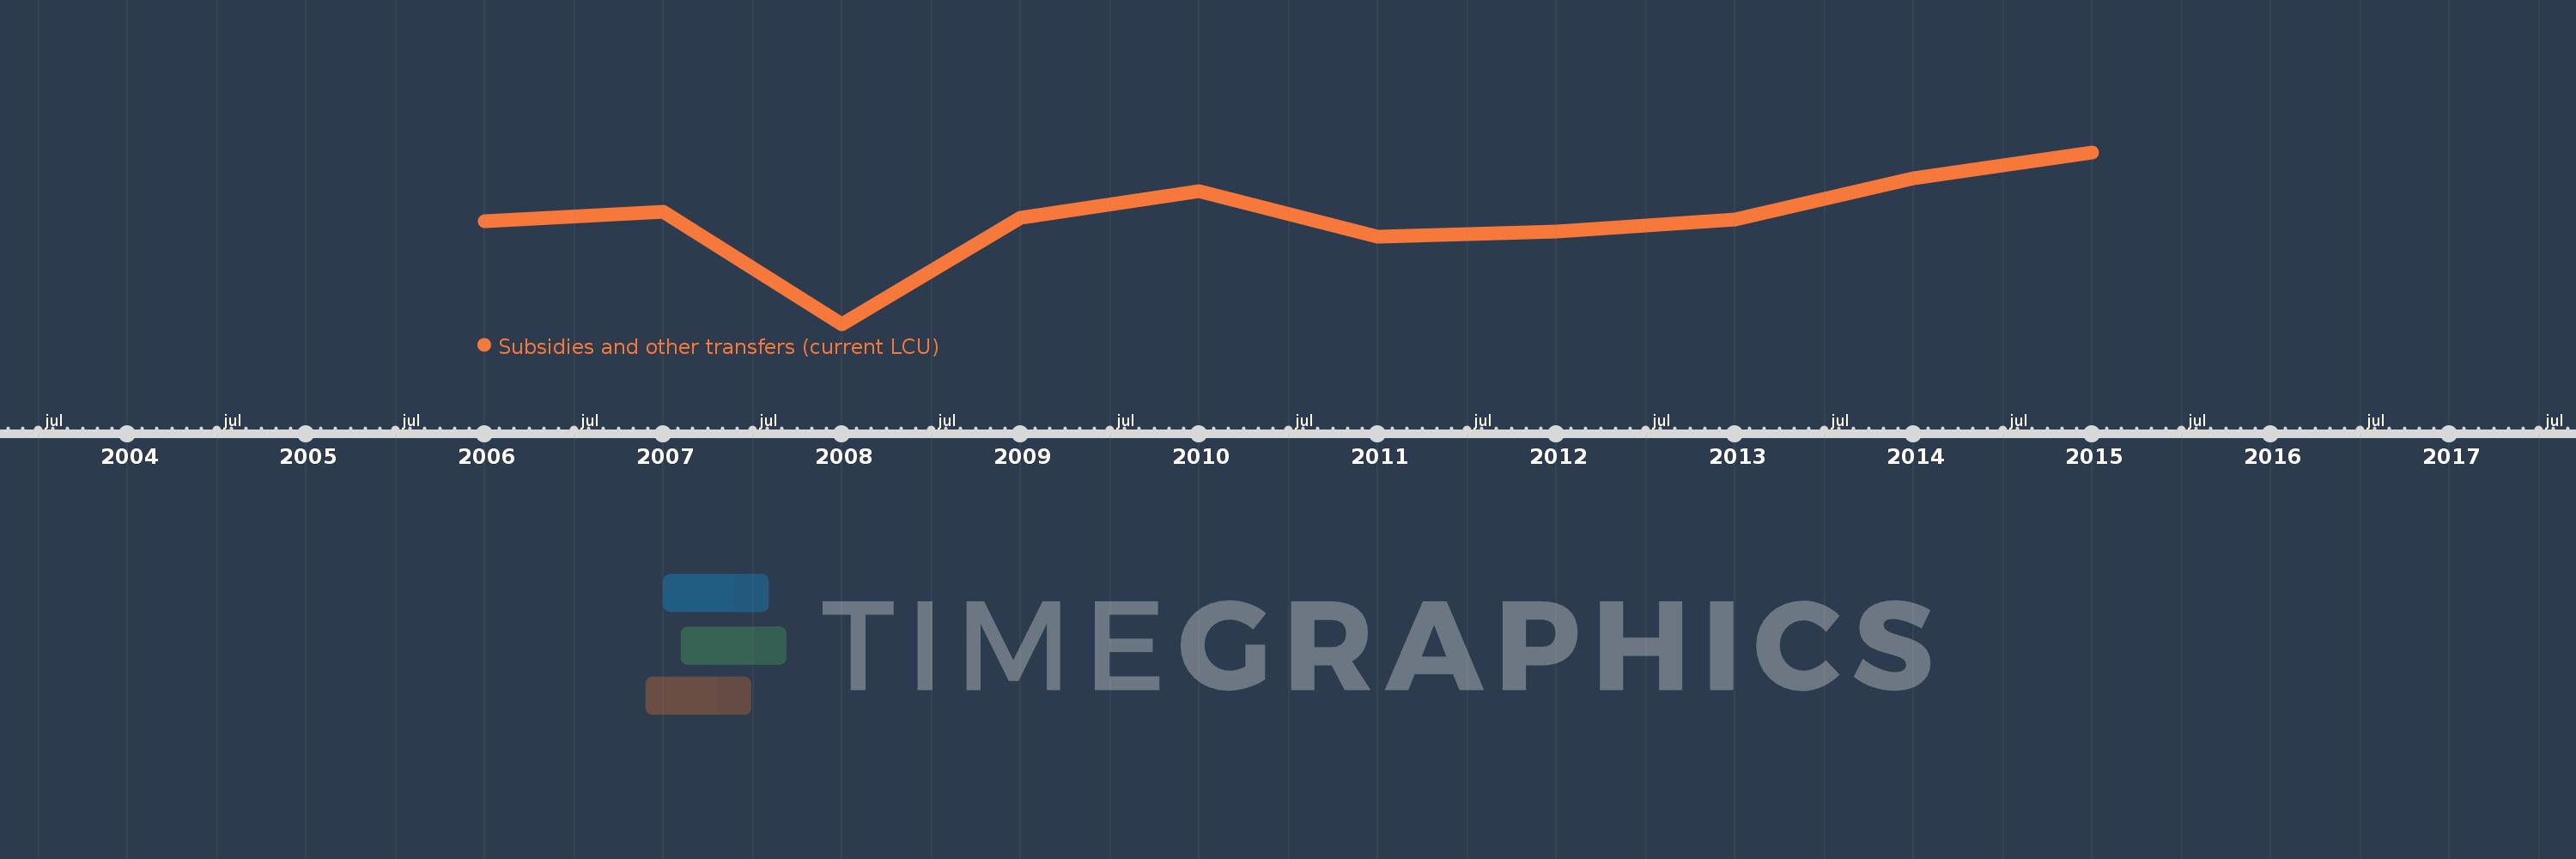
Questa scala temporale mostra un grafico dal 2006 anno al 2015 anno. West Bank and Gaza. I dati fino ad 2005 anno non disponibili. Il numero di osservazioni attuali secondo i date: 10.
La fonte (nome):
Indicatori dello sviluppo mondiale
La fonte (organizzazione):
International Monetary Fund, Government Finance Statistics Yearbook and data files.
Categorie:
Public Sector
sono stati aggiornati
23 apr 2017 anni
Indicatori delle variazioni dei valori per anni
In media:
552.067 Mln
Minima:
180.0 Mln
1 gen 2008 anni
Massimo:
783.426 Mln
1 gen 2015 anni
Alla data di osservazione
Valore
Variazione assoluta
La variazione rispetto al valore precedente
1 gen 2006 anni
541.255 Mln
+541.255 Mln
0.0%
1 gen 2007 anni
576.15 Mln
+34.895 Mln
6.45%
1 gen 2008 anni
180.0 Mln
-396.15 Mln
-68.76%
1 gen 2009 anni
555.069 Mln
+375.069 Mln
208.37%
1 gen 2010 anni
648.601 Mln
+93.532 Mln
16.85%
1 gen 2011 anni
488.898 Mln
-159.703 Mln
-24.62%
1 gen 2012 anni
505.44 Mln
+16.542 Mln
3.38%
1 gen 2013 anni
549.112 Mln
+43.672 Mln
8.64%
1 gen 2014 anni
692.716 Mln
+143.605 Mln
26.15%
1 gen 2015 anni
783.426 Mln
+90.709 Mln
13.09%
Classificazione dei paesi secondo i statistiche attuali per anni