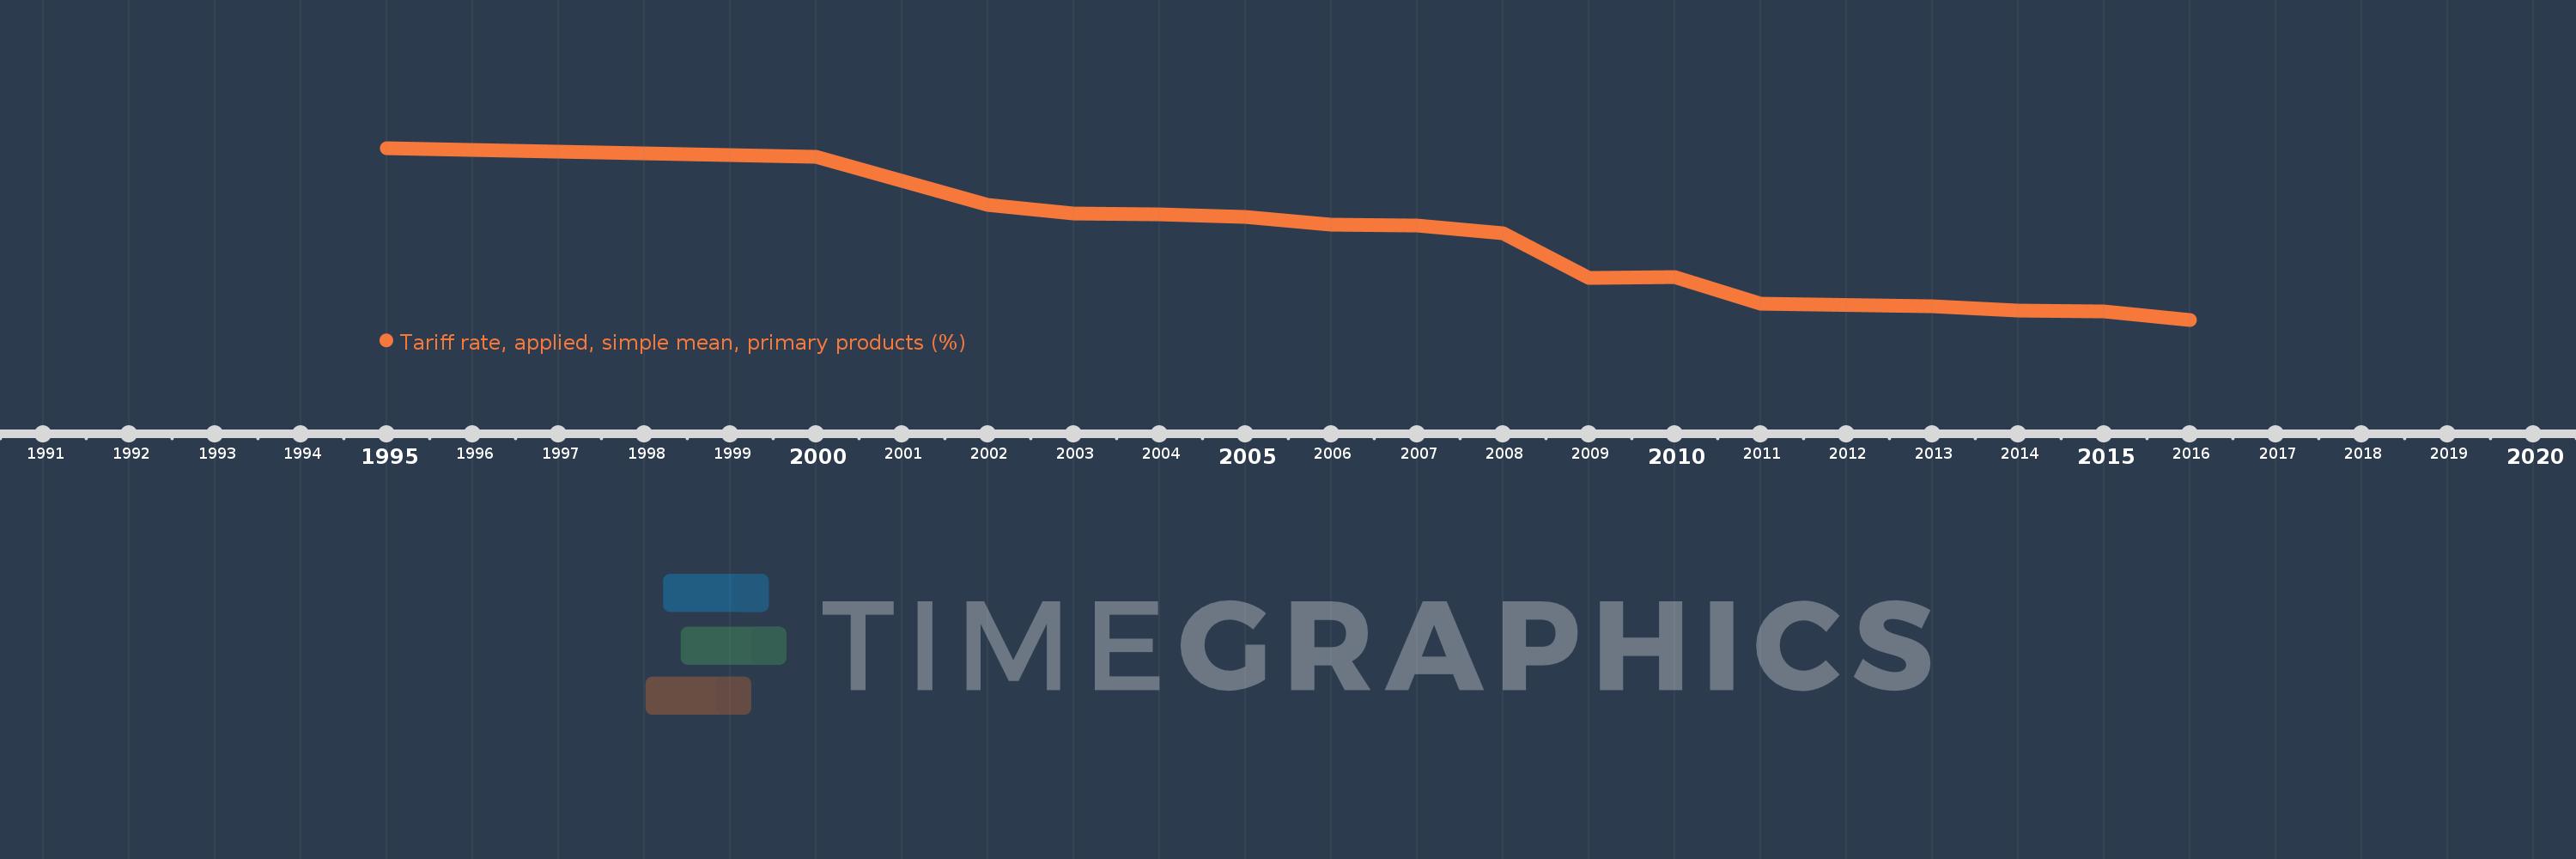
Questa scala temporale mostra un grafico dal 1995 anno al 2016 anno. Vietnam. I dati fino ad 1994 anno non disponibili. Il numero di osservazioni attuali secondo i date: 16.
La fonte (nome):
Indicatori dello sviluppo mondiale
La fonte (organizzazione):
World Bank staff estimates using the World Integrated Trade Solution system, based on data from United Nations Conference on Trade and Development's Trade Analysis and Information System (TRAINS) database and the World Trade Organization’s (WTO) Integrated Data Base (IDB) and Consolidated Tariff Schedules (CTS) database.
Categorie:
Private Sector, Trade
sono stati aggiornati
23 apr 2017 anni
Indicatori delle variazioni dei valori per anni
In media:
13.454
Minima:
7.26
1 gen 2016 anni
Massimo:
21.77
1 gen 1995 anni
Alla data di osservazione
Valore
Variazione assoluta
La variazione rispetto al valore precedente
1 gen 1995 anni
21.77
+21.77
0.0%
1 gen 2000 anni
21.04
-0.73
-3.35%
1 gen 2002 anni
16.98
-4.06
-19.3%
1 gen 2003 anni
16.26
-0.72
-4.24%
1 gen 2004 anni
16.14
-0.12
-0.74%
1 gen 2005 anni
15.97
-0.17
-1.05%
1 gen 2006 anni
15.3
-0.67
-4.2%
1 gen 2007 anni
15.24
-0.06
-0.39%
1 gen 2008 anni
14.59
-0.65
-4.27%
1 gen 2009 anni
10.77
-3.82
-26.18%
1 gen 2010 anni
10.83
+0.06
0.56%
1 gen 2011 anni
8.64
-2.19
-20.22%
1 gen 2013 anni
8.42
-0.22
-2.55%
1 gen 2014 anni
8.07
-0.35
-4.16%
1 gen 2015 anni
7.99
-0.08
-0.99%
1 gen 2016 anni
7.26
-0.73
-9.14%
Classificazione dei paesi secondo i statistiche attuali per anni