Download Queste statistiche in altri paesi:
Linea del tempo:
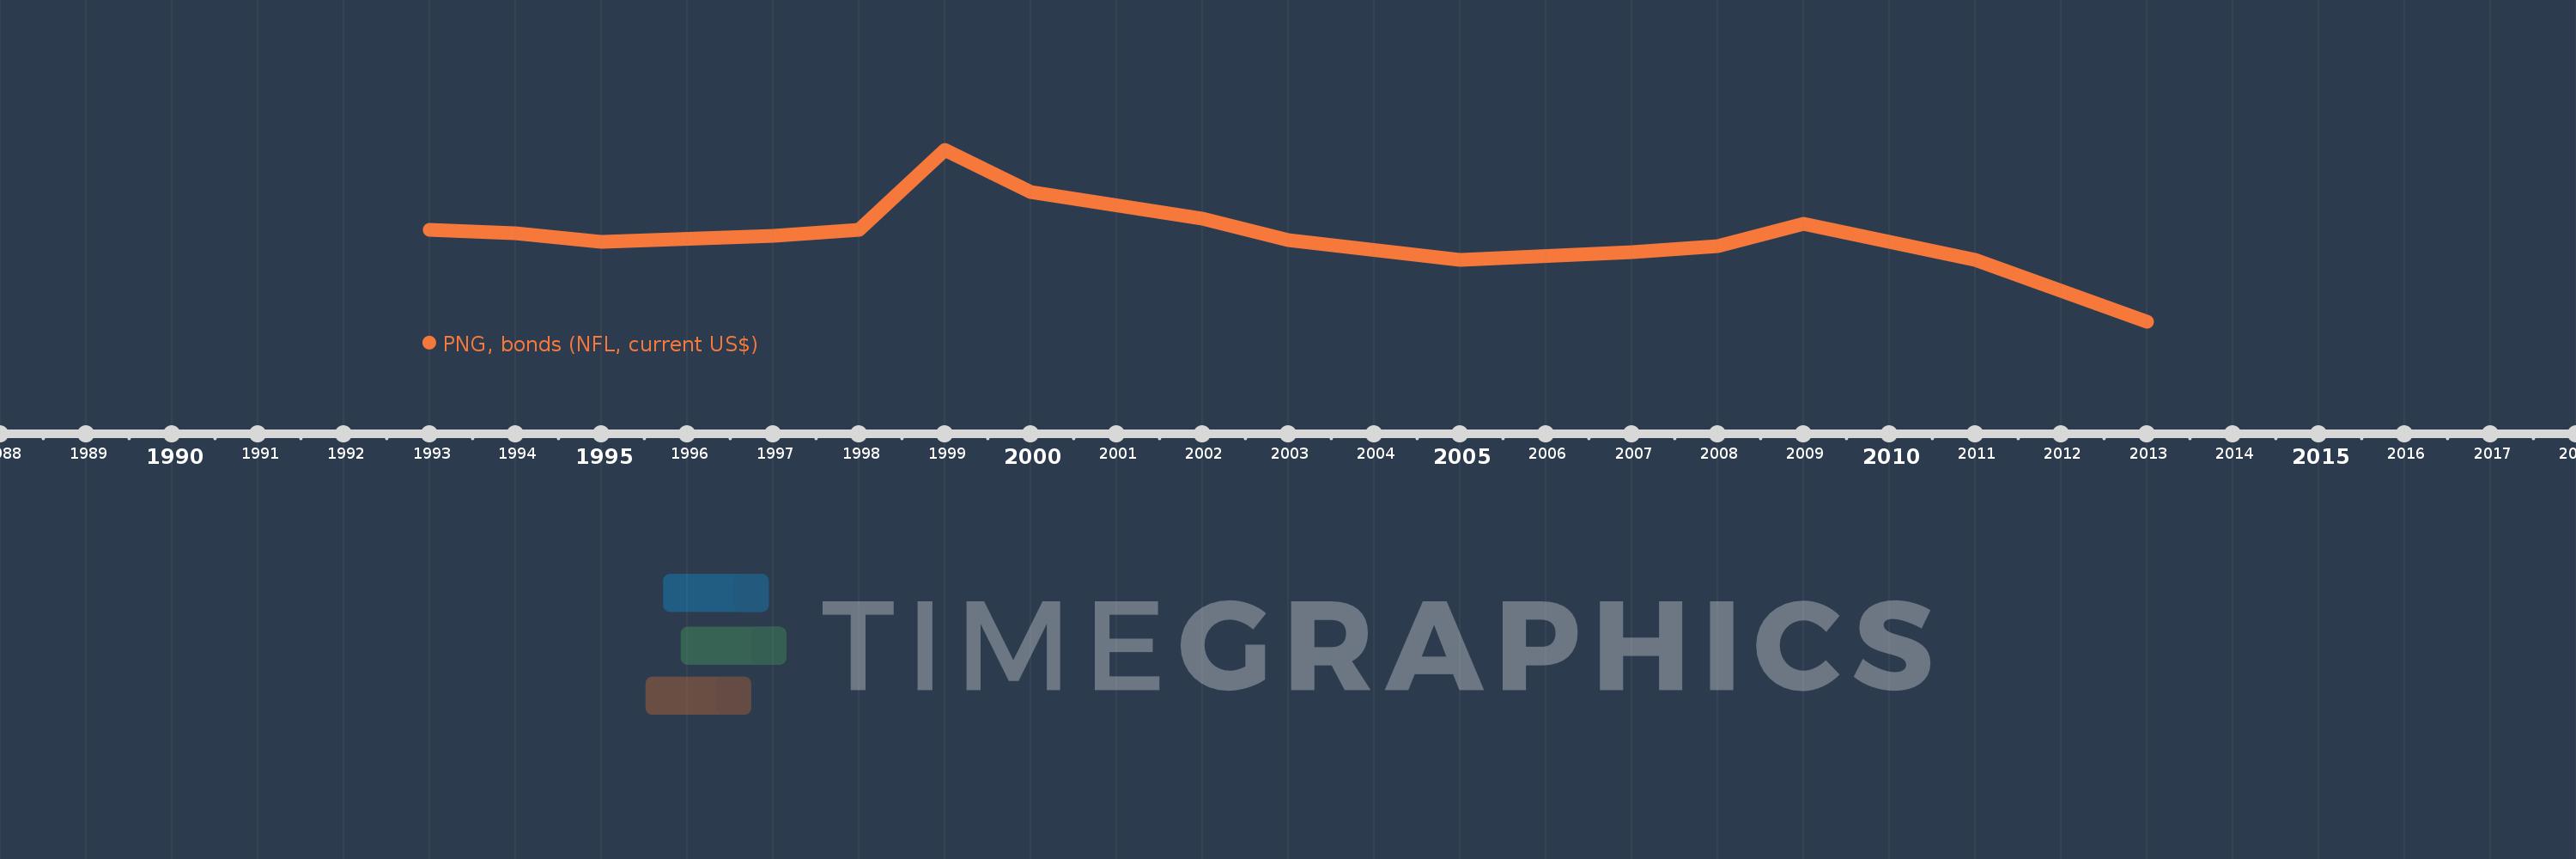
Questa scala temporale mostra un grafico dal 1993 anno al 2013 anno. Venezuela, RB. I dati fino ad 1992 anno non disponibili. Il numero di osservazioni attuali secondo i date: 15.
La fonte (nome):
Indicatori dello sviluppo mondiale
La fonte (organizzazione):
World Bank, International Debt Statistics.
Categorie:
External Debt
sono stati aggiornati
23 apr 2017 anni
Indicatori delle variazioni dei valori per anni
Minima:
-2.365 Mlrd
1 gen 2013 anni
Massimo:
2.375 Mlrd
1 gen 1999 anni
Alla data di osservazione
Valore
Variazione assoluta
La variazione rispetto al valore precedente
1 gen 1993 anni
174.0 Mln
+174.0 Mln
0.0%
1 gen 1994 anni
90.0 Mln
-84.0 Mln
-48.28%
1 gen 1995 anni
-150.0 Mln
-240.0 Mln
-266.67%
1 gen 1997 anni
20.0 Mln
+170.0 Mln
-113.33%
1 gen 1998 anni
185.0 Mln
+165.0 Mln
825.0%
1 gen 1999 anni
2.375 Mlrd
+2.19 Mlrd
1.18 Mille.%
1 gen 2000 anni
1.213 Mlrd
-1.162 Mlrd
-48.91%
1 gen 2002 anni
480.0 Mln
-733.363 Mln
-60.44%
1 gen 2003 anni
-100.0 Mln
-580.0 Mln
-120.83%
1 gen 2005 anni
-640.0 Mln
-540.0 Mln
540.0%
1 gen 2007 anni
-446.052 Mln
+193.948 Mln
-30.3%
1 gen 2008 anni
-274.0 Mln
+172.052 Mln
-38.57%
1 gen 2009 anni
350.0 Mln
+624.0 Mln
-227.74%
1 gen 2011 anni
-659.052 Mln
-1.009 Mlrd
-288.3%
1 gen 2013 anni
-2.365 Mlrd
-1.706 Mlrd
258.89%
Classificazione dei paesi secondo i statistiche attuali per anni