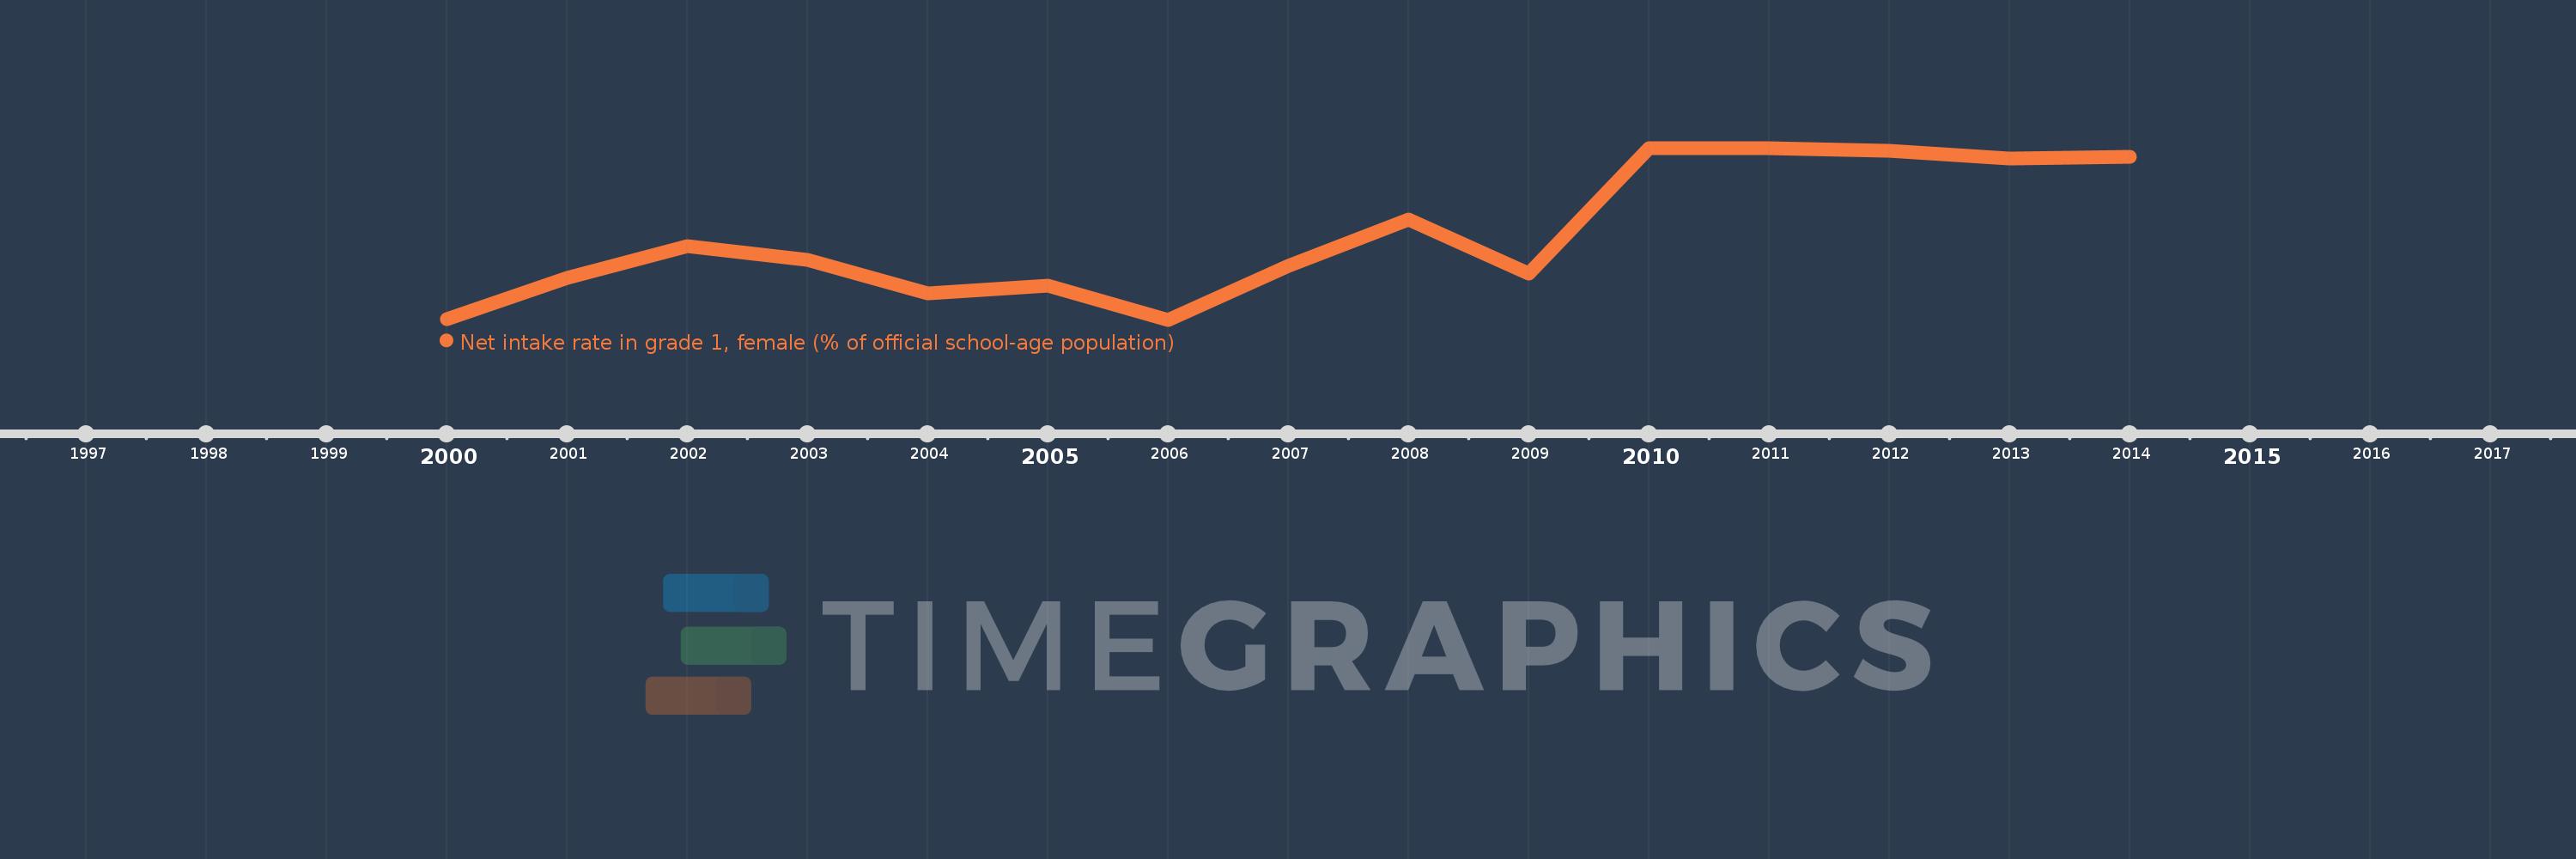
Questa scala temporale mostra un grafico dal 2000 anno al 2014 anno. Venezuela, RB. I dati fino ad 1999 anno non disponibili. Il numero di osservazioni attuali secondo i date: 15.
La fonte (nome):
Indicatori dello sviluppo mondiale
La fonte (organizzazione):
United Nations Educational, Scientific, and Cultural Organization (UNESCO) Institute for Statistics.
Categorie:
Education, Gender
sono stati aggiornati
23 apr 2017 anni
Indicatori delle variazioni dei valori per anni
In media:
66.991
Minima:
59.127
1 gen 2006 anni
Massimo:
75.044
1 gen 2010 anni
Alla data di osservazione
Valore
Variazione assoluta
La variazione rispetto al valore precedente
1 gen 2000 anni
59.214
+59.214
0.0%
1 gen 2001 anni
63.002
+3.788
6.4%
1 gen 2002 anni
65.966
+2.963
4.7%
1 gen 2003 anni
64.666
-1.3
-1.97%
1 gen 2004 anni
61.605
-3.061
-4.73%
1 gen 2005 anni
62.279
+0.674
1.09%
1 gen 2006 anni
59.127
-3.152
-5.06%
1 gen 2007 anni
64.12
+4.993
8.44%
1 gen 2008 anni
68.383
+4.263
6.65%
1 gen 2009 anni
63.407
-4.976
-7.28%
1 gen 2010 anni
75.044
+11.637
18.35%
1 gen 2011 anni
75.003
-0.041
-0.06%
1 gen 2012 anni
74.754
-0.249
-0.33%
1 gen 2013 anni
74.095
-0.659
-0.88%
1 gen 2014 anni
74.197
+0.102
0.14%
Classificazione dei paesi secondo i statistiche attuali per anni