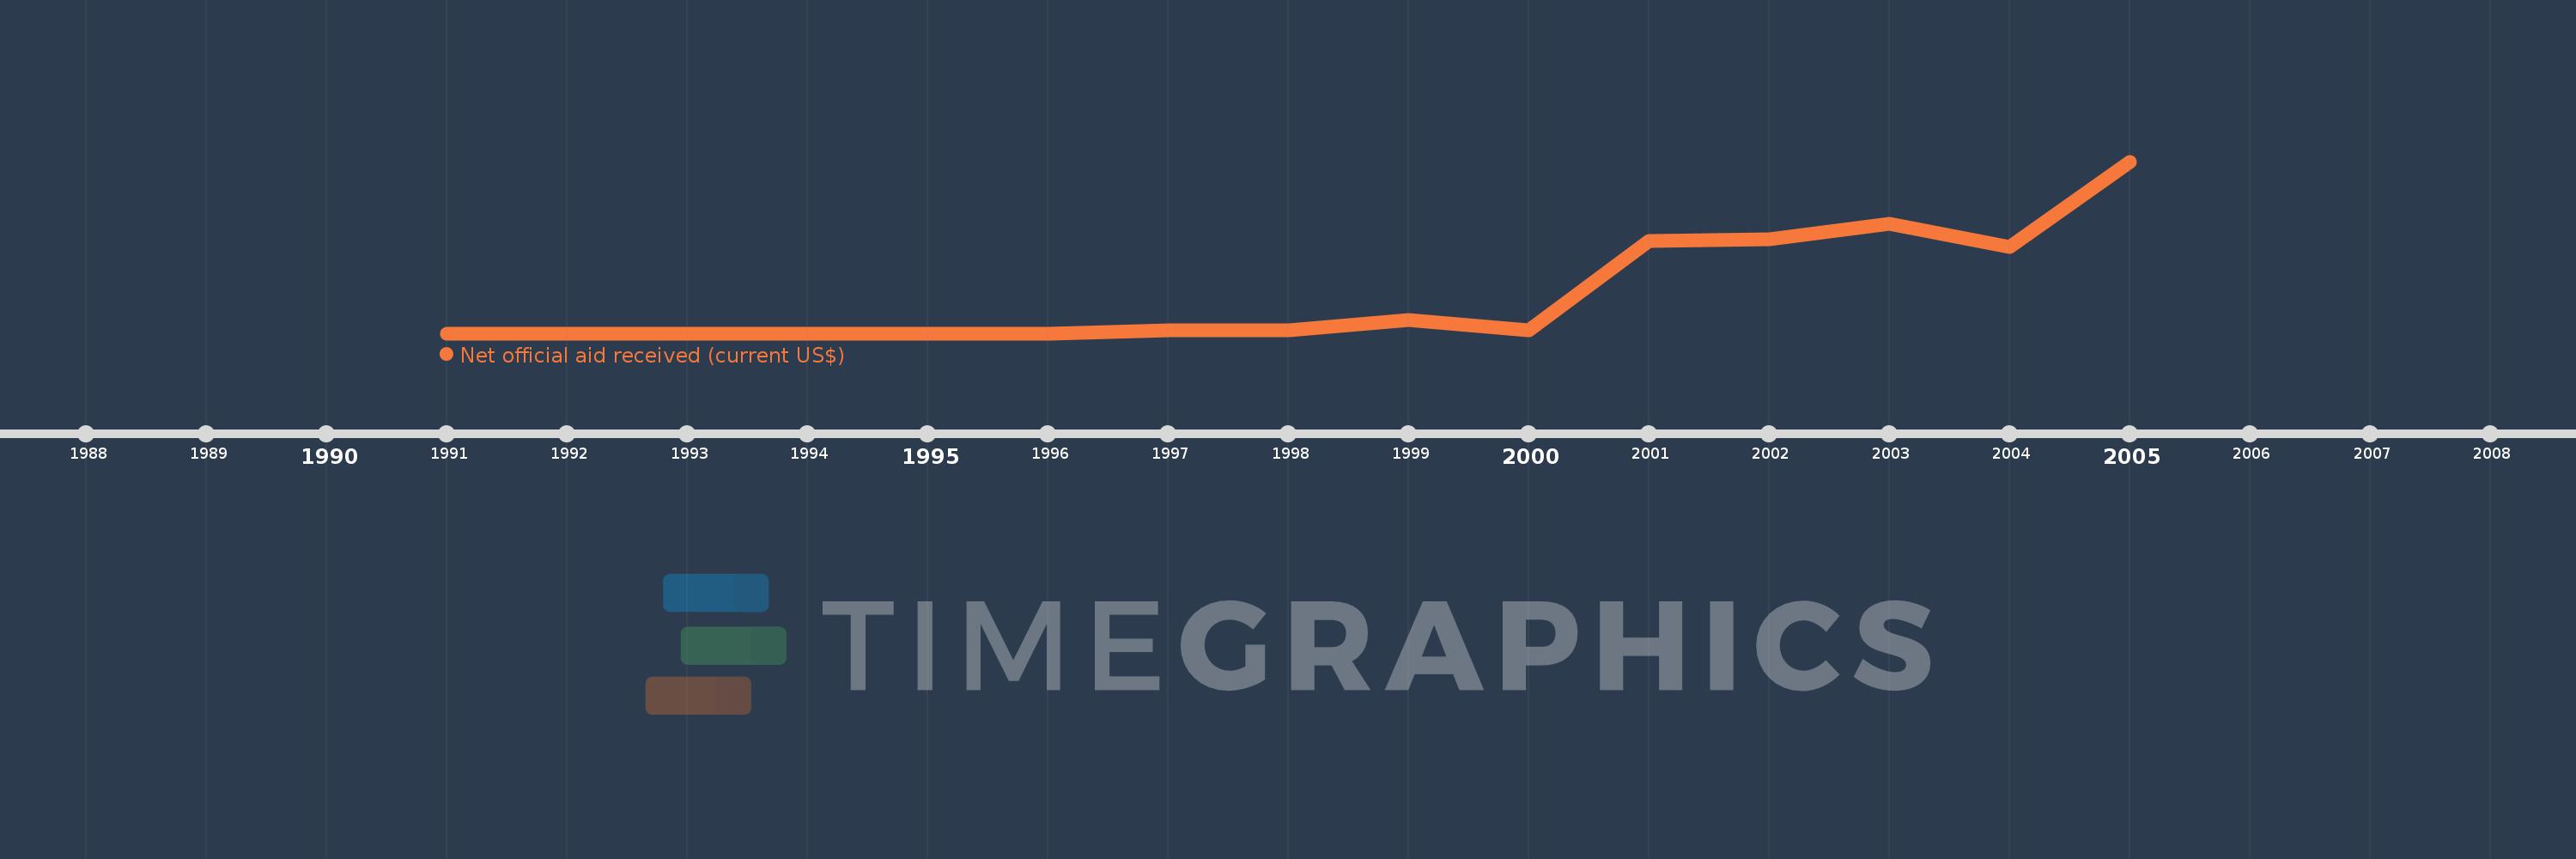
Questa scala temporale mostra un grafico dal 1991 anno al 2005 anno. East Asia & Pacific. I dati fino ad 1990 anno non disponibili. Il numero di osservazioni attuali secondo i date: 15.
La fonte (nome):
Indicatori dello sviluppo mondiale
La fonte (organizzazione):
Development Assistance Committee of the Organisation for Economic Co-operation and Development, Geographical Distribution of Financial Flows to Developing Countries, Development Co-operation Report, and International Development Statistics database. Data are available online at: www.oecd.org/dac/stats/idsonline.
Categorie:
Aid Effectiveness
sono stati aggiornati
23 apr 2017 anni
Indicatori delle variazioni dei valori per anni
In media:
238.239 Mln
Minima:
0.0
1 gen 1991 anni
Massimo:
1.067 Mlrd
1 gen 2005 anni
Alla data di osservazione
Valore
Variazione assoluta
La variazione rispetto al valore precedente
1 gen 1991 anni
0.0
0.0
0.0%
1 gen 1992 anni
0.0
0.0
%
1 gen 1993 anni
0.0
0.0
%
1 gen 1994 anni
0.0
0.0
%
1 gen 1995 anni
0.0
0.0
%
1 gen 1996 anni
0.0
0.0
%
1 gen 1997 anni
18.05 Mln
+18.05 Mln
%
1 gen 1998 anni
17.29 Mln
-760.0 Mille.
-4.21%
1 gen 1999 anni
85.25 Mln
+67.96 Mln
393.06%
1 gen 2000 anni
17.35 Mln
-67.9 Mln
-79.65%
1 gen 2001 anni
570.79 Mln
+553.44 Mln
3.19 Mille.%
1 gen 2002 anni
585.82 Mln
+15.03 Mln
2.63%
1 gen 2003 anni
677.58 Mln
+91.76 Mln
15.66%
1 gen 2004 anni
534.87 Mln
-142.71 Mln
-21.06%
1 gen 2005 anni
1.067 Mlrd
+531.71 Mln
99.41%
Classificazione dei paesi secondo i statistiche attuali per anni