33
/it/
AIzaSyB4mHJ5NPEv-XzF7P6NDYXjlkCWaeKw5bc
November 30, 2025
270260
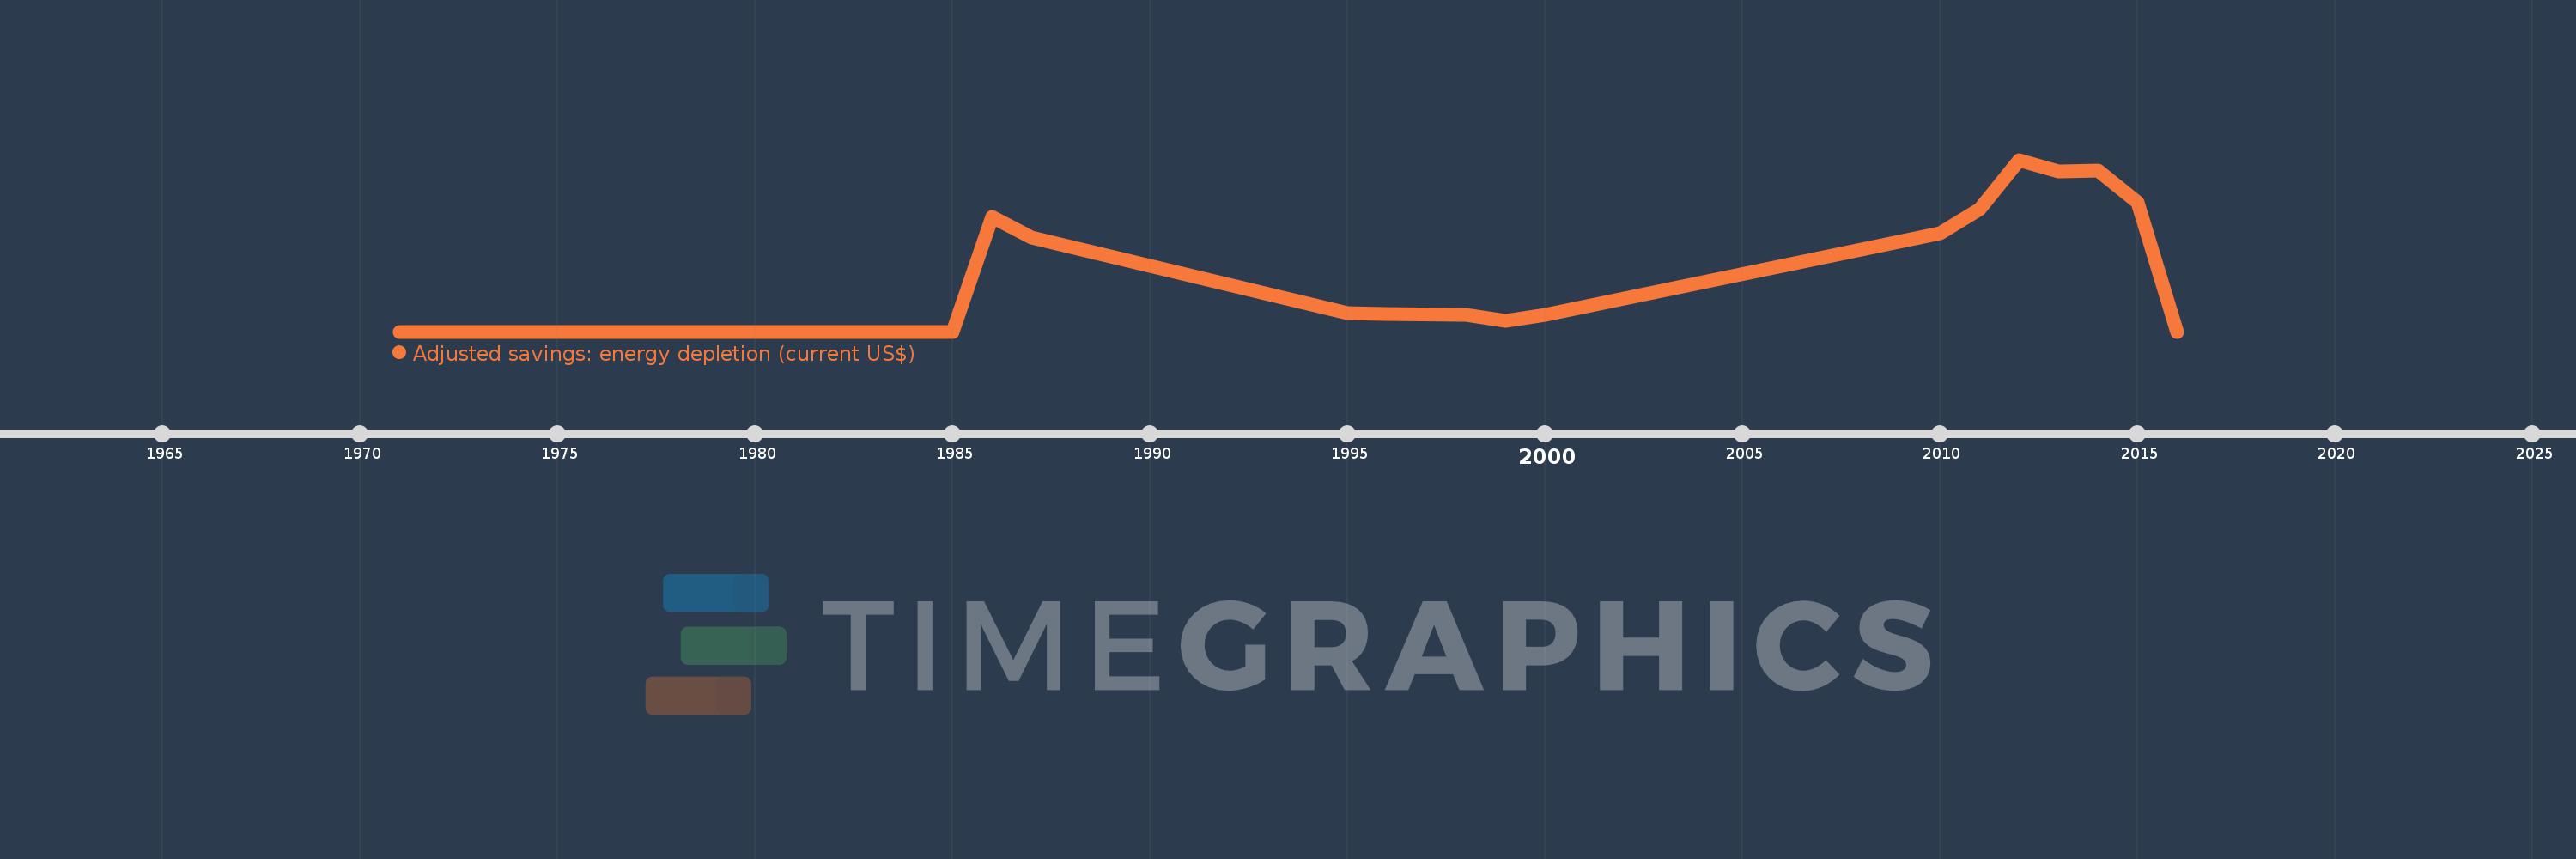
Turkmenistan
TKM
true
2
1
Adjusted savings: energy depletion (current US$)
2016,2015,2014,2013,2012,2011,2010,2000,1999,1998,1996,1995,1987,1986,1985,1984,1983,1982,1981,1980,1979,1978,1977,1976,1975,1974,1973,1972,1971