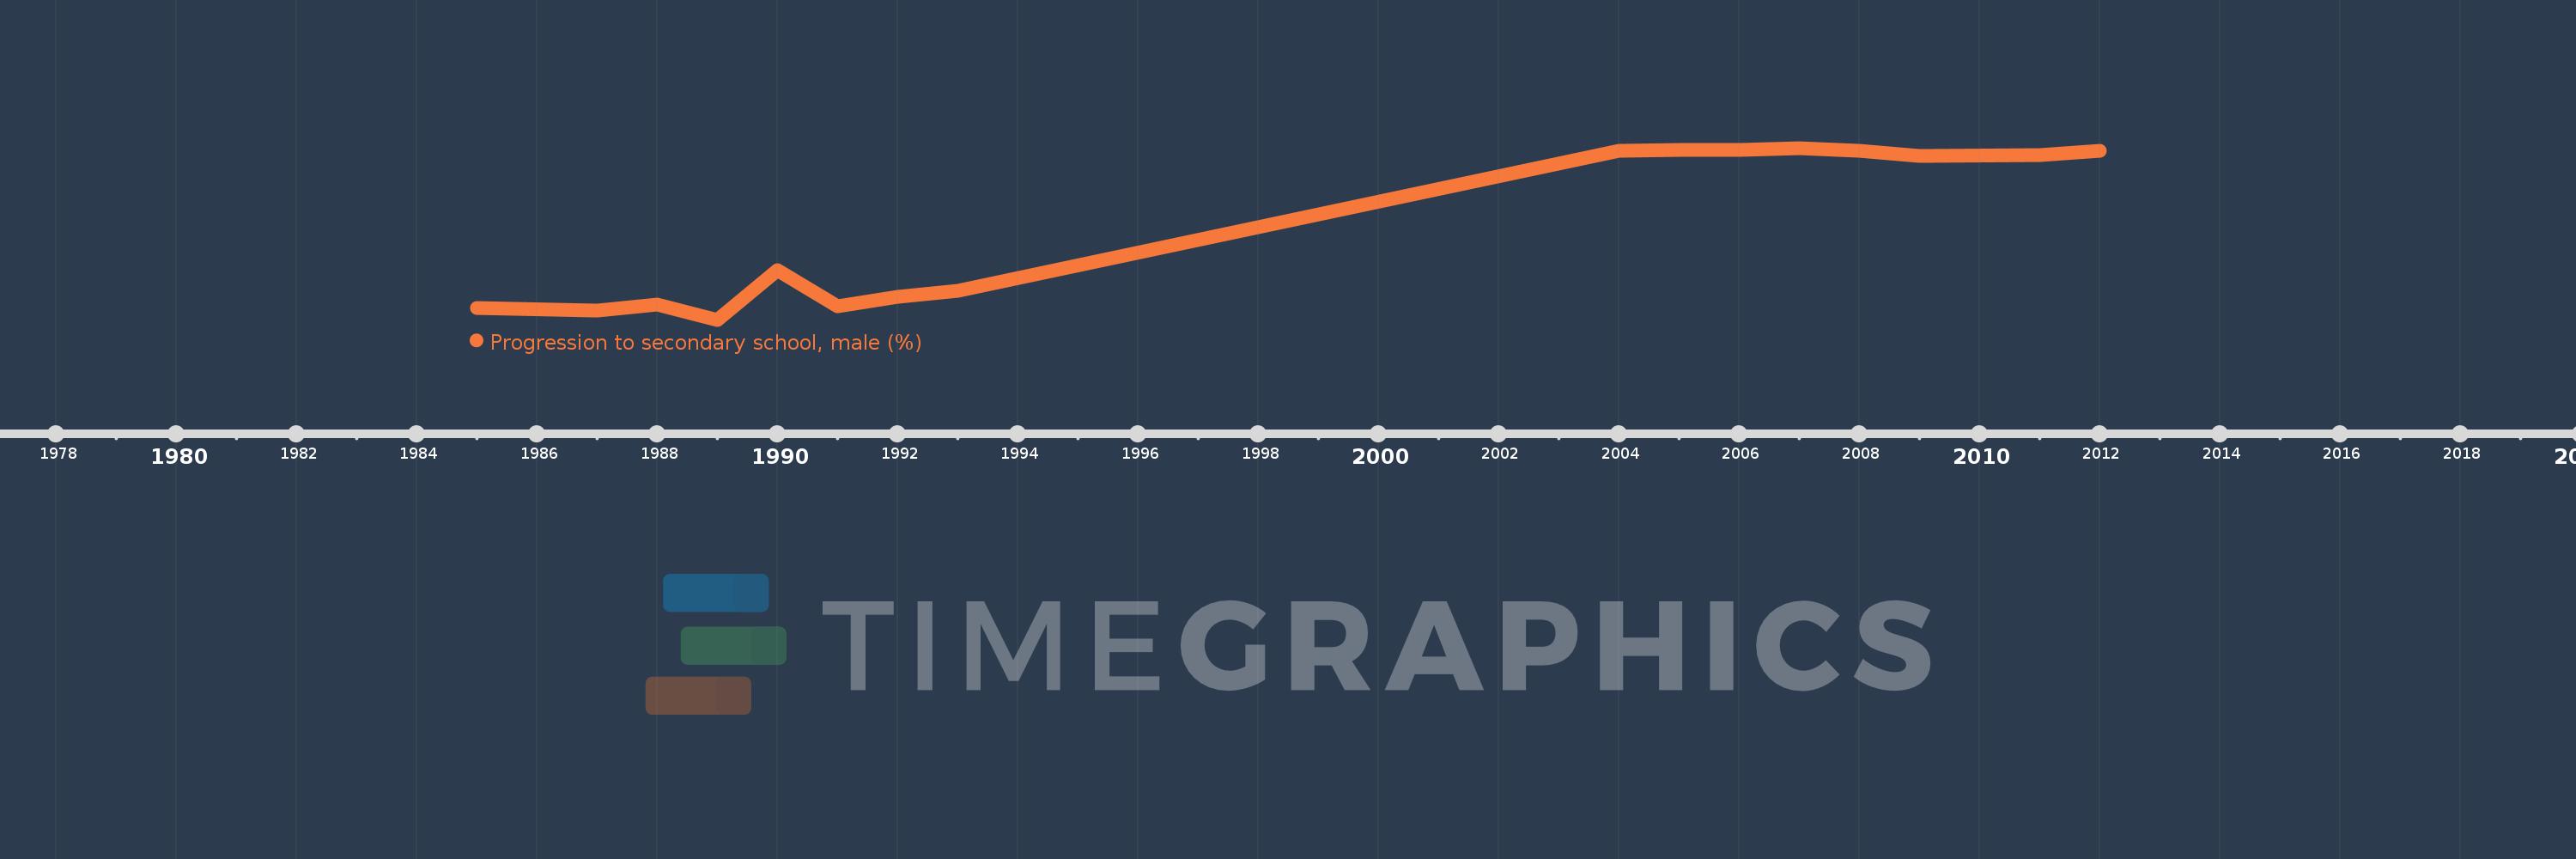
Questa scala temporale mostra un grafico dal 1985 anno al 2012 anno. Turkey. I dati fino ad 1984 anno non disponibili. Il numero di osservazioni attuali secondo i date: 16.
La fonte (nome):
Indicatori dello sviluppo mondiale
La fonte (organizzazione):
United Nations Educational, Scientific, and Cultural Organization (UNESCO) Institute for Statistics.
Categorie:
Education, Gender
sono stati aggiornati
23 apr 2017 anni
Indicatori delle variazioni dei valori per anni
In media:
77.817
Minima:
51.186
1 gen 1989 anni
Massimo:
100.0
1 gen 2007 anni
Alla data di osservazione
Valore
Variazione assoluta
La variazione rispetto al valore precedente
1 gen 1985 anni
54.427
+54.427
0.0%
1 gen 1987 anni
53.818
-0.609
-1.12%
1 gen 1988 anni
55.593
+1.775
3.3%
1 gen 1989 anni
51.186
-4.408
-7.93%
1 gen 1990 anni
65.327
+14.141
27.63%
1 gen 1991 anni
55.134
-10.193
-15.6%
1 gen 1992 anni
57.676
+2.541
4.61%
1 gen 1993 anni
59.502
+1.826
3.17%
1 gen 2004 anni
99.08
+39.578
66.52%
1 gen 2005 anni
99.518
+0.438
0.44%
1 gen 2006 anni
99.54
+0.023
0.02%
1 gen 2007 anni
100.0
+0.46
0.46%
1 gen 2008 anni
99.316
-0.684
-0.68%
1 gen 2009 anni
97.849
-1.467
-1.48%
1 gen 2011 anni
97.872
+0.023
0.02%
1 gen 2012 anni
99.238
+1.366
1.4%
Classificazione dei paesi secondo i statistiche attuali per anni