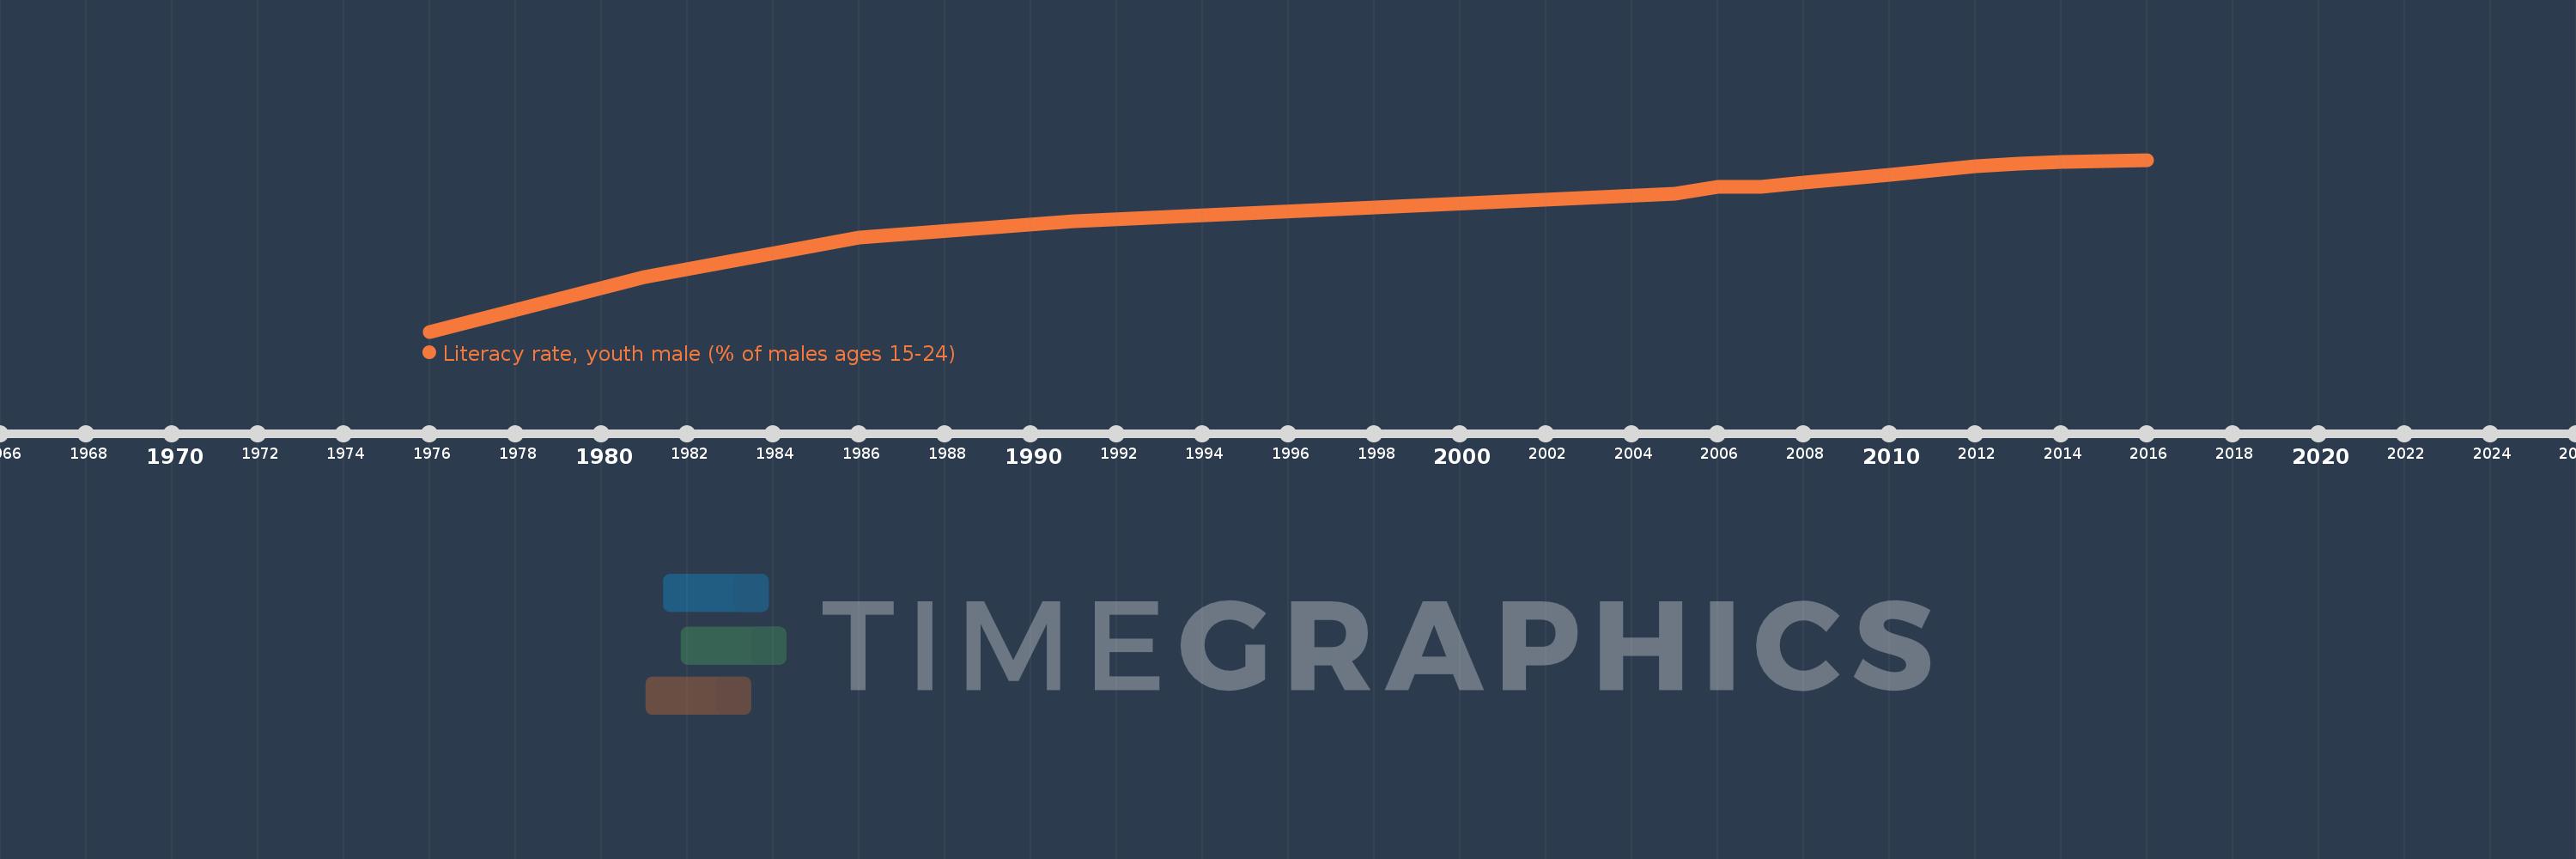
Questa scala temporale mostra un grafico dal 1976 anno al 2016 anno. Turkey. I dati fino ad 1975 anno non disponibili. Il numero di osservazioni attuali secondo i date: 15.
La fonte (nome):
Indicatori dello sviluppo mondiale
La fonte (organizzazione):
United Nations Educational, Scientific, and Cultural Organization (UNESCO) Institute for Statistics.
Categorie:
Education, Gender
sono stati aggiornati
23 apr 2017 anni
Indicatori delle variazioni dei valori per anni
In media:
97.765
Minima:
90.754
1 gen 1976 anni
Massimo:
99.799
1 gen 2016 anni
Alla data di osservazione
Valore
Variazione assoluta
La variazione rispetto al valore precedente
1 gen 1976 anni
90.754
+90.754
0.0%
1 gen 1981 anni
93.622
+2.868
3.16%
1 gen 1986 anni
95.684
+2.062
2.2%
1 gen 1991 anni
96.571
+0.887
0.93%
1 gen 2005 anni
98.024
+1.454
1.51%
1 gen 2006 anni
98.361
+0.336
0.34%
1 gen 2007 anni
98.366
+0.005
0.01%
1 gen 2008 anni
98.585
+0.219
0.22%
1 gen 2010 anni
99.019
+0.434
0.44%
1 gen 2011 anni
99.214
+0.195
0.2%
1 gen 2012 anni
99.447
+0.233
0.23%
1 gen 2013 anni
99.59
+0.144
0.14%
1 gen 2014 anni
99.689
+0.099
0.1%
1 gen 2015 anni
99.747
+0.058
0.06%
1 gen 2016 anni
99.799
+0.052
0.05%
Classificazione dei paesi secondo i statistiche attuali per anni