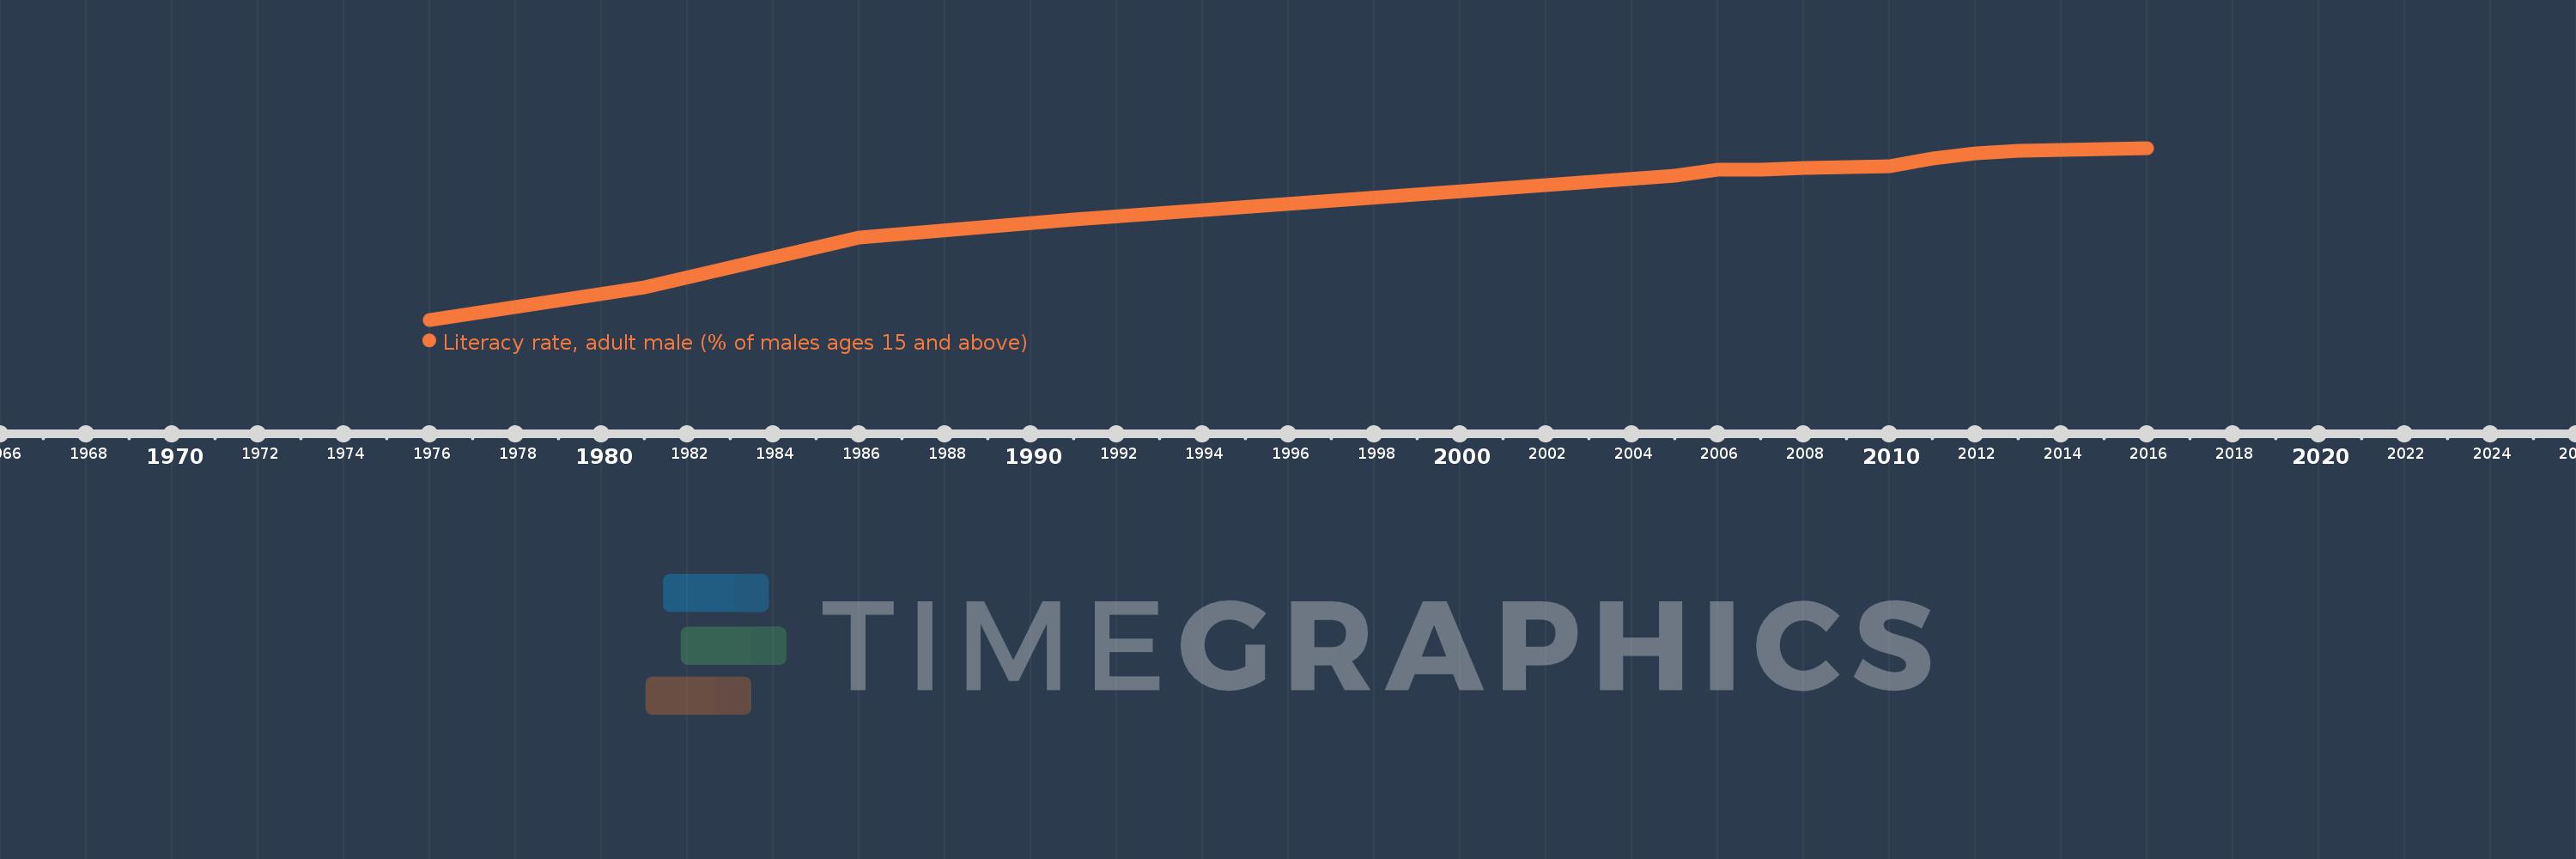
Questa scala temporale mostra un grafico dal 1976 anno al 2016 anno. Turkey. I dati fino ad 1975 anno non disponibili. Il numero di osservazioni attuali secondo i date: 15.
La fonte (nome):
Indicatori dello sviluppo mondiale
La fonte (organizzazione):
United Nations Educational, Scientific, and Cultural Organization (UNESCO) Institute for Statistics.
Categorie:
Education, Gender
sono stati aggiornati
23 apr 2017 anni
Indicatori delle variazioni dei valori per anni
In media:
93.687
Minima:
77.504
1 gen 1976 anni
Massimo:
98.647
1 gen 2016 anni
Alla data di osservazione
Valore
Variazione assoluta
La variazione rispetto al valore precedente
1 gen 1976 anni
77.504
+77.504
0.0%
1 gen 1981 anni
81.449
+3.946
5.09%
1 gen 1986 anni
87.62
+6.17
7.58%
1 gen 1991 anni
89.847
+2.227
2.54%
1 gen 2005 anni
95.273
+5.426
6.04%
1 gen 2006 anni
96.001
+0.727
0.76%
1 gen 2007 anni
95.996
-0.005
-0.01%
1 gen 2008 anni
96.202
+0.206
0.21%
1 gen 2010 anni
96.378
+0.176
0.18%
1 gen 2011 anni
97.3
+0.922
0.96%
1 gen 2012 anni
97.935
+0.635
0.65%
1 gen 2013 anni
98.263
+0.328
0.33%
1 gen 2014 anni
98.401
+0.138
0.14%
1 gen 2015 anni
98.497
+0.095
0.1%
1 gen 2016 anni
98.647
+0.15
0.15%
Classificazione dei paesi secondo i statistiche attuali per anni