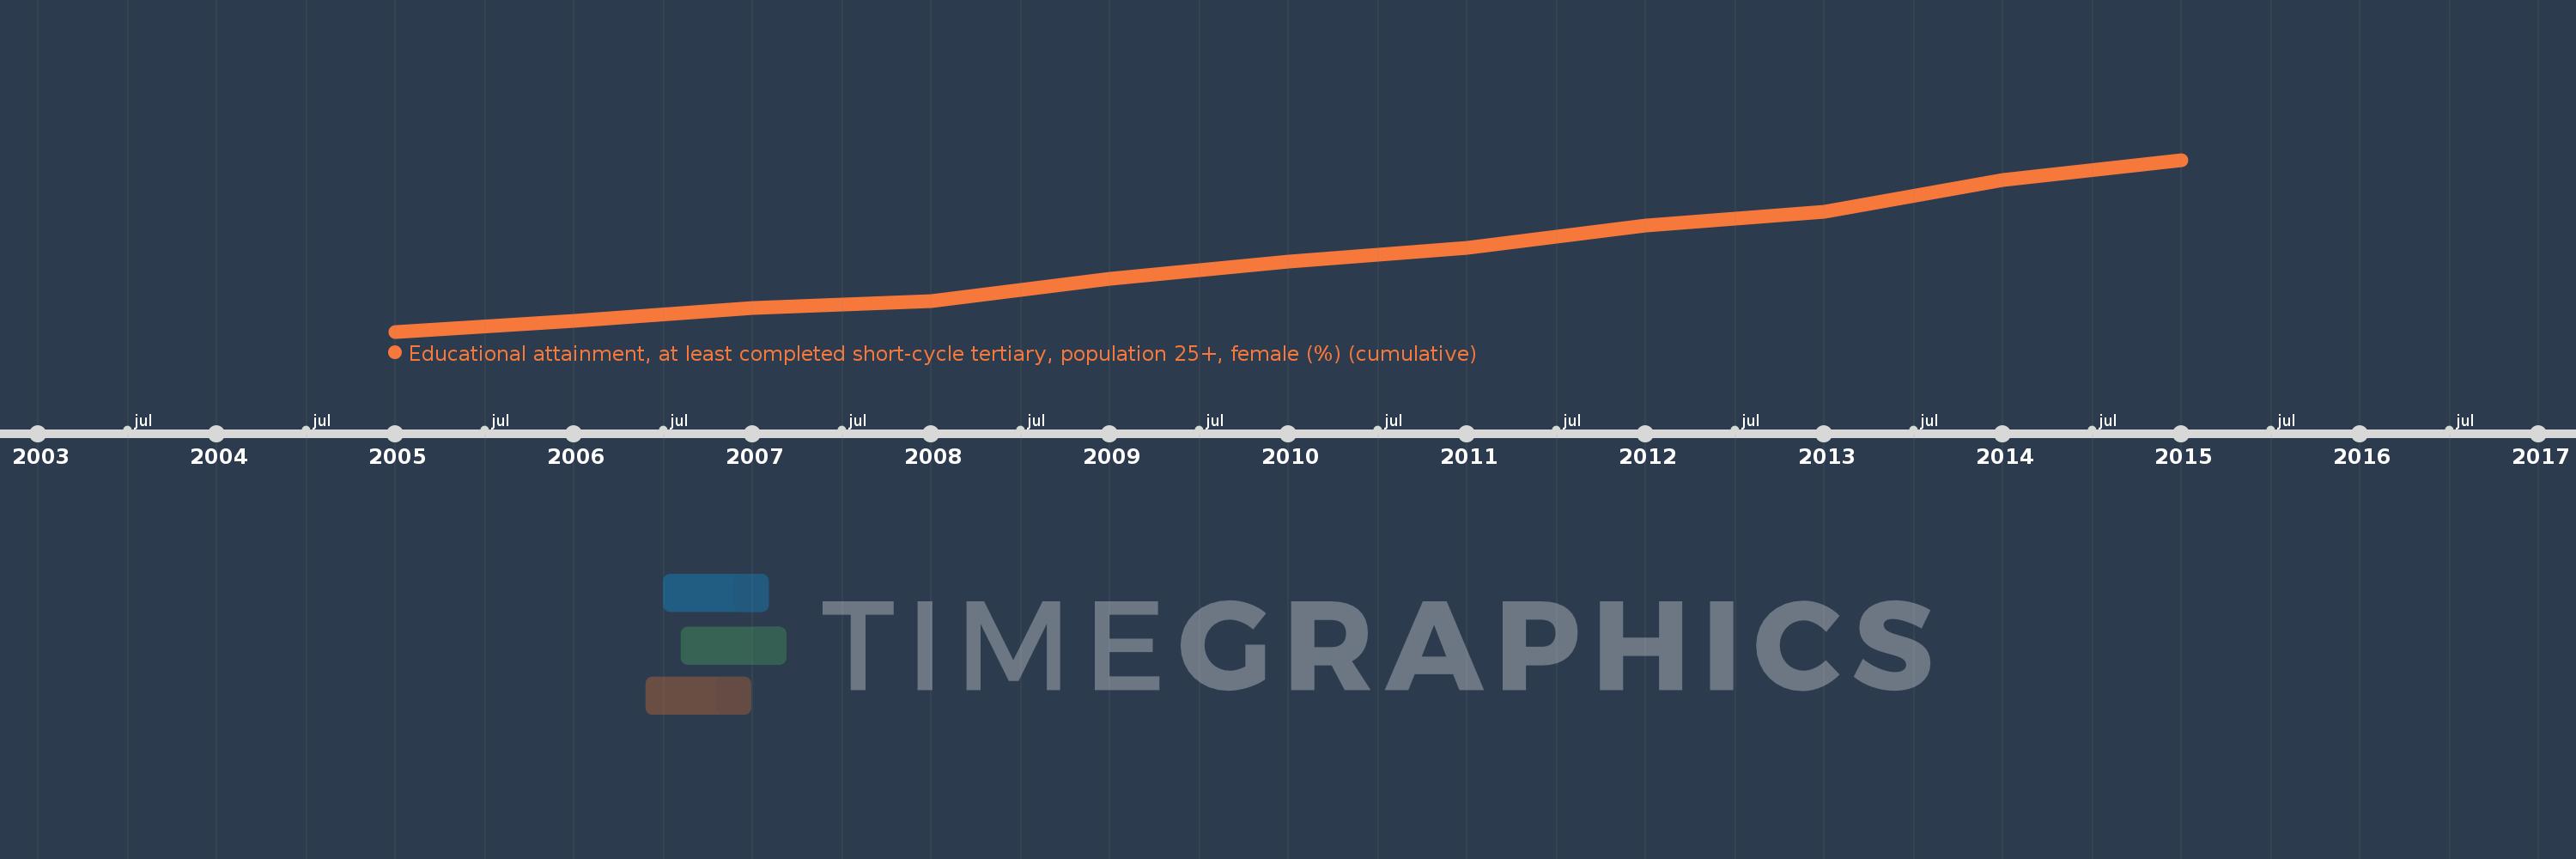
Questa scala temporale mostra un grafico dal 2005 anno al 2015 anno. Turkey. I dati fino ad 2004 anno non disponibili. Il numero di osservazioni attuali secondo i date: 11.
La fonte (nome):
Indicatori dello sviluppo mondiale
La fonte (organizzazione):
United Nations Educational, Scientific, and Cultural Organization (UNESCO) Institute for Statistics.
Categorie:
Education, Gender
sono stati aggiornati
23 apr 2017 anni
Indicatori delle variazioni dei valori per anni
In media:
8.637
Minima:
5.104
1 gen 2005 anni
Massimo:
13.23
1 gen 2015 anni
Alla data di osservazione
Valore
Variazione assoluta
La variazione rispetto al valore precedente
1 gen 2005 anni
5.104
+5.104
0.0%
1 gen 2006 anni
5.63
+0.526
10.3%
1 gen 2007 anni
6.209
+0.579
10.28%
1 gen 2008 anni
6.557
+0.349
5.62%
1 gen 2009 anni
7.617
+1.059
16.15%
1 gen 2010 anni
8.405
+0.788
10.35%
1 gen 2011 anni
9.076
+0.672
7.99%
1 gen 2012 anni
10.126
+1.05
11.57%
1 gen 2013 anni
10.79
+0.664
6.55%
1 gen 2014 anni
12.268
+1.478
13.7%
1 gen 2015 anni
13.23
+0.962
7.84%
Classificazione dei paesi secondo i statistiche attuali per anni