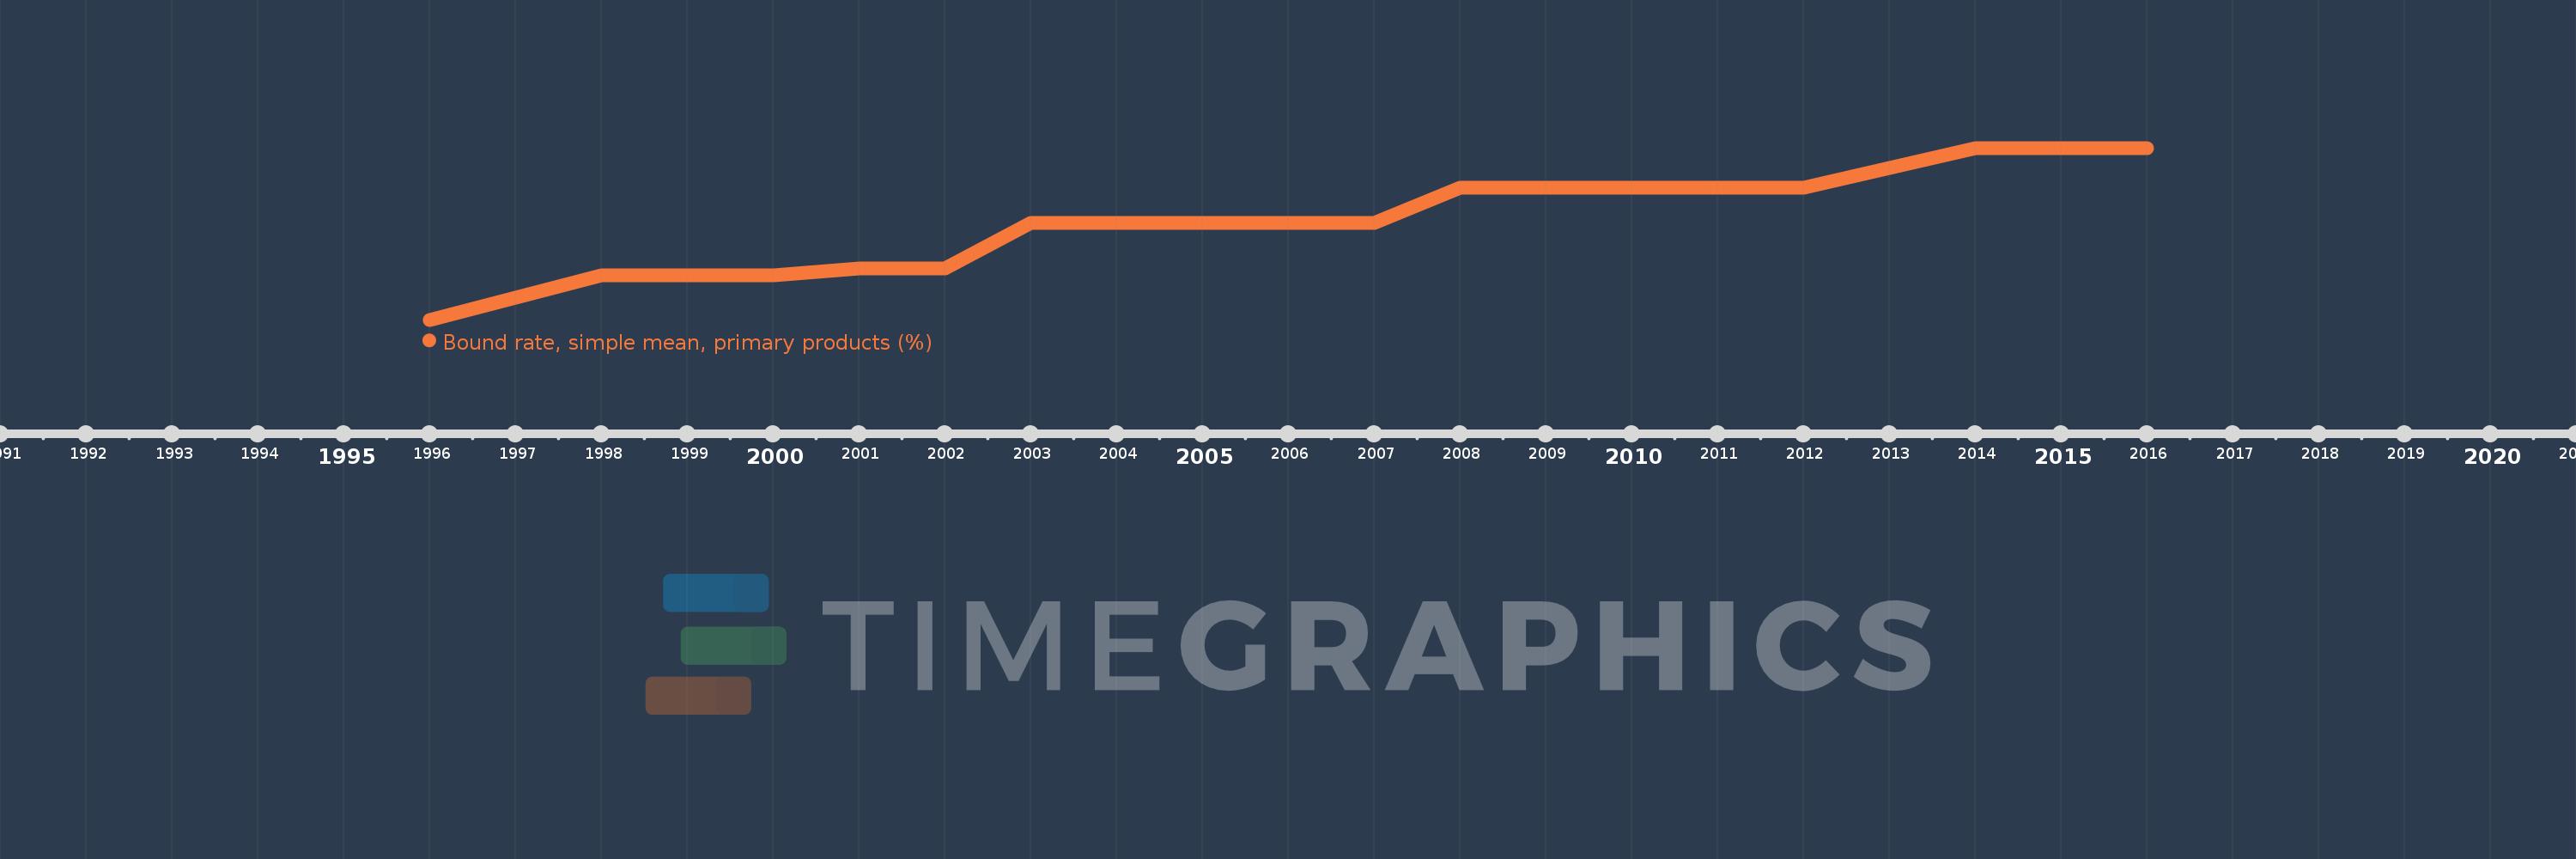
Questa scala temporale mostra un grafico dal 1996 anno al 2016 anno. Turkey. I dati fino ad 1995 anno non disponibili. Il numero di osservazioni attuali secondo i date: 17.
La fonte (nome):
Indicatori dello sviluppo mondiale
La fonte (organizzazione):
World Bank staff estimates using the World Integrated Trade Solution system, based on data from World Trade Organization.
Categorie:
Private Sector, Trade
sono stati aggiornati
23 apr 2017 anni
Indicatori delle variazioni dei valori per anni
In media:
55.728
Minima:
53.22
1 gen 1996 anni
Massimo:
57.58
1 gen 2014 anni
Alla data di osservazione
Valore
Variazione assoluta
La variazione rispetto al valore precedente
1 gen 1996 anni
53.22
+53.22
0.0%
1 gen 1998 anni
54.34
+1.12
2.1%
1 gen 2000 anni
54.34
0.0
0.0%
1 gen 2001 anni
54.53
+0.19
0.35%
1 gen 2002 anni
54.53
0.0
0.0%
1 gen 2003 anni
55.67
+1.14
2.09%
1 gen 2004 anni
55.67
0.0
0.0%
1 gen 2005 anni
55.67
0.0
0.0%
1 gen 2006 anni
55.67
0.0
0.0%
1 gen 2007 anni
55.67
0.0
0.0%
1 gen 2008 anni
56.58
+0.91
1.63%
1 gen 2009 anni
56.58
0.0
0.0%
1 gen 2010 anni
56.58
0.0
0.0%
1 gen 2011 anni
56.58
0.0
0.0%
1 gen 2012 anni
56.58
0.0
0.0%
1 gen 2014 anni
57.58
+1.0
1.77%
1 gen 2016 anni
57.58
0.0
0.0%
Classificazione dei paesi secondo i statistiche attuali per anni