33
/it/
AIzaSyB4mHJ5NPEv-XzF7P6NDYXjlkCWaeKw5bc
November 30, 2025
267532
Trinidad and Tobago
TTO
true
2
1
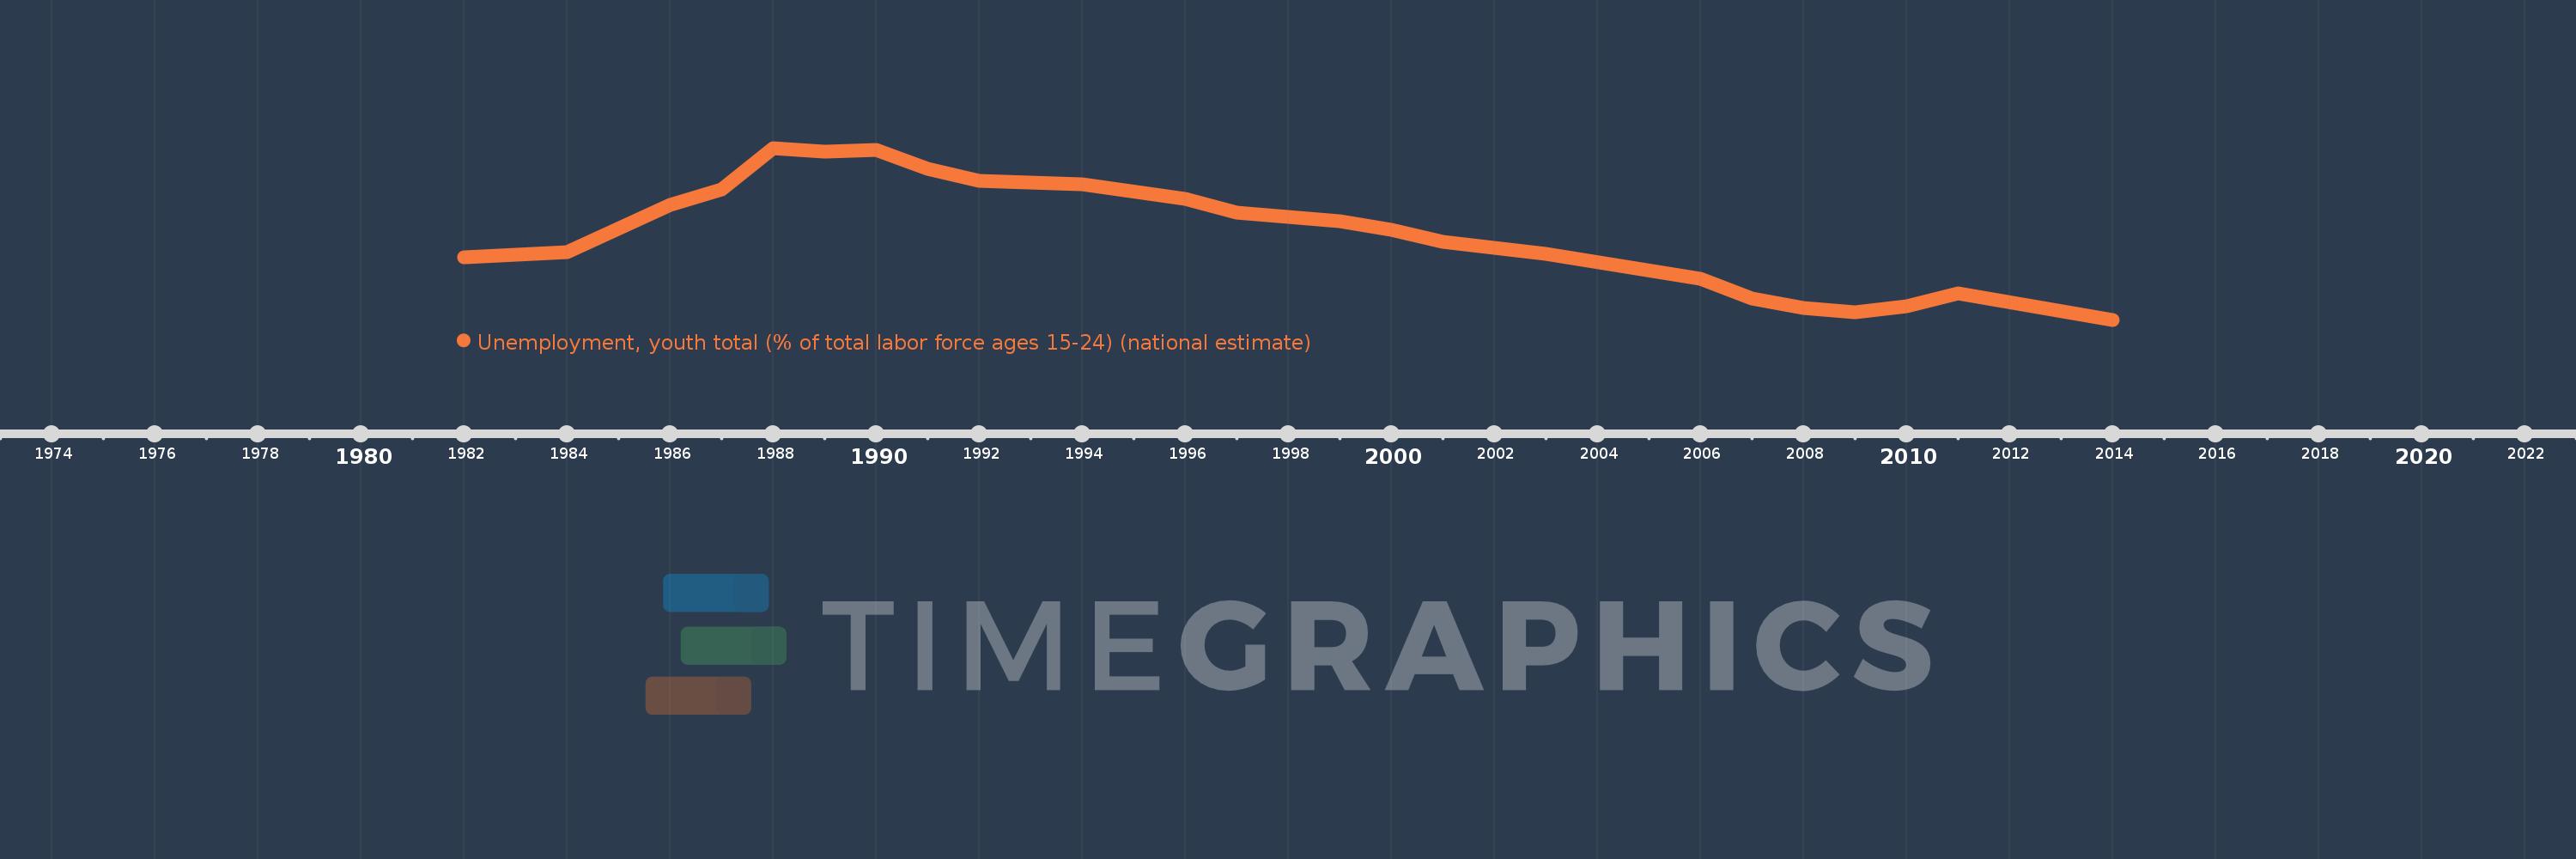
Unemployment, youth total (% of total labor force ages 15-24) (national estimate)
2014,2011,2010,2009,2008,2007,2006,2003,2001,2000,1999,1997,1996,1994,1992,1991,1990,1989,1988,1987,1986,1984,1982