33
/it/
AIzaSyB4mHJ5NPEv-XzF7P6NDYXjlkCWaeKw5bc
November 30, 2025
267373
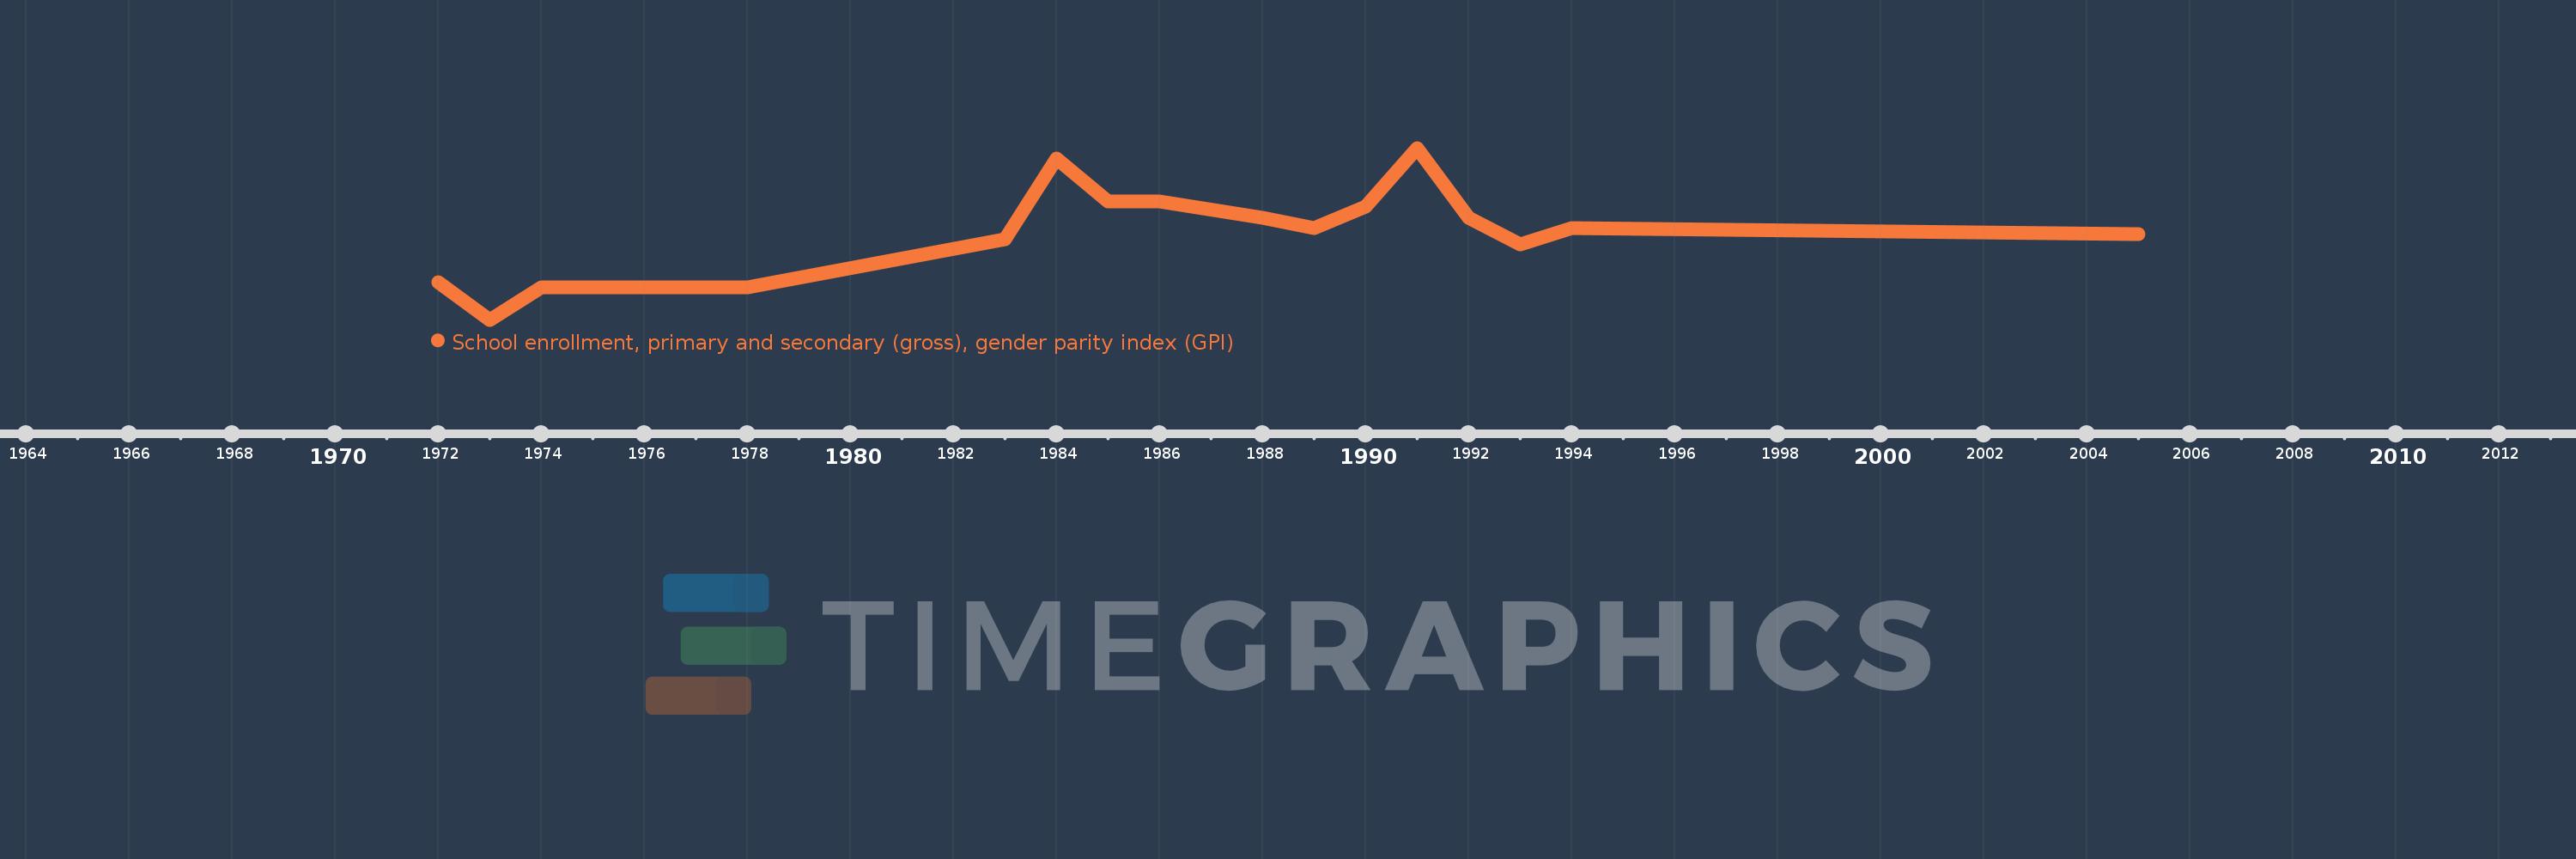
Trinidad and Tobago
TTO
true
2
1
School enrollment, primary and secondary (gross), gender parity index (GPI)
2005,1994,1993,1992,1991,1990,1989,1988,1986,1985,1984,1983,1978,1974,1973,1972